' fill='none' stroke='%23304560' stroke-miterlimit='10' stroke-width='2'/%3e%3c/svg%3e)

The pitfalls of chasing statistical significance: Don’t add more data to make your results significant!
Dr. Vanessa Cave
27 July 2022
Recently I was reviewing a scientific publication and a certain segment in the Methods section caused me to sweat. In brief, the authors had performed an analysis on a data set with n observations. After discovering an interesting but non-significant effect, they had added a further m observations to their data set and re-analysed it to “increase the power”.
Before I delve in to why adding more data to achieve significance is an issue, firstly I would like to commend the authors on providing a complete description of their methods, and not glossing over important details such as the one above. Only by reporting our methodology accurately and completely can our research be properly scrutinized and independently reproduced, and our findings appropriately interpreted.
The issue with adding more data for significance
So, what’s the problem with adding more data to achieve statistical significance?
Well… in doing so you increase the probability of obtaining a significant effect by random chance. In other words, you increase the chance of a type I error (i.e., rejecting the null hypothesis when in fact it is true).
Understanding the impact of conditional data addition
At the nub of the issue is the decision to add more data based on a known outcome. In particular, the addition of the m extra observations is conditional on the results from the analysis of the first n observations. You can read more about this in Professor James Curran’s excellent StatsChat blog entitled “Just one more…”. This blog illustrates the issue very nicely using a coin toss example and a horse racing analogy.
Examining the dangers: A simple example
Say we’re interested in comparing two means: and . We construct an appropriate statistical test based on the following null () and alternative () hypotheses:
format('truetype')%3Bfont-weight%3Anormal%3Bfont-style%3Anormal%3B%7D%40font-face%7Bfont-family%3A'math1e73b84a23c3d1c1163dfc45bd2'%3Bsrc%3Aurl(data%3Afont%2Ftruetype%3Bcharset%3Dutf-8%3Bbase64%2CAAEAAAAMAIAAAwBAT1MvMi7iBBMAAADMAAAATmNtYXDEvmKUAAABHAAAADxjdnQgDVUNBwAAAVgAAAA6Z2x5ZoPi2VsAAAGUAAABTmhlYWQQC2qxAAAC5AAAADZoaGVhCGsXSAAAAxwAAAAkaG10eE2rRkcAAANAAAAADGxvY2EAHTwYAAADTAAAABBtYXhwBT0FPgAAA1wAAAAgbmFtZaBxlY4AAAN8AAABn3Bvc3QB9wD6AAAFHAAAACBwcmVwa1uragAABTwAAAAUAAADSwGQAAUAAAQABAAAAAAABAAEAAAAAAAAAQEAAAAAAAAAAAAAAAAAAAAAAAAAAAAAAAAAAAAAACAgICAAAAAg1UADev96AAAD6ACWAAAAAAACAAEAAQAAABQAAwABAAAAFAAEACgAAAAGAAQAAQACAD0iYP%2F%2FAAAAPSJg%2F%2F%2F%2FxN2iAAEAAAAAAAAAAAFUAywAgAEAAFYAKgJYAh4BDgEsAiwAWgGAAoAAoADUAIAAAAAAAAAAKwBVAIAAqwDVAQABKwAHAAAAAgBVAAADAAOrAAMABwAAMxEhESUhESFVAqv9qwIA%2FgADq%2FxVVQMAAAIAgADrAtUCFQADAAcAZRgBsAgQsAbUsAYQsAXUsAgQsAHUsAEQsADUsAYQsAc8sAUQsAQ8sAEQsAI8sAAQsAM8ALAIELAG1LAGELAH1LAHELAB1LABELAC1LAGELAFPLAHELAEPLABELAAPLACELADPDEwEyE1IR0BITWAAlX9qwJVAcBV1VVVAAMAgABzAtUCjwADAAcACwBlGAGwDBCwBtSwBhCwBdSwDBCwAdSwARCwANSwBhCwBzywBRCwBDywARCwAjywABCwAzwAsAwQsAbUsAYQsAfUsAcQsAHUsAEQsALUsAYQsAU8sAcQsAQ8sAEQsAA8sAIQsAM8MTATITUhHQEhNQMBMwGAAlX9qwJVf%2F5WVQGrAcBV1VVVAU%2F95AIcAAAAAQAAAAEAANV4zkFfDzz1AAMEAP%2F%2F%2F%2F%2FWOhNz%2F%2F%2F%2F%2F9Y6E3MAAP8gBIADqwAAAAoAAgABAAAAAAABAAAD6P9qAAAXcAAA%2F7YEgAABAAAAAAAAAAAAAAAAAAAAAwNSAFUDVgCAA1YAgAAAAAAAAAAoAAAAsgAAAU4AAQAAAAMAXgAFAAAAAAACAIAEAAAAAAAEAADeAAAAAAAAABUBAgAAAAAAAAABABIAAAAAAAAAAAACAA4AEgAAAAAAAAADADAAIAAAAAAAAAAEABIAUAAAAAAAAAAFABYAYgAAAAAAAAAGAAkAeAAAAAAAAAAIABwAgQABAAAAAAABABIAAAABAAAAAAACAA4AEgABAAAAAAADADAAIAABAAAAAAAEABIAUAABAAAAAAAFABYAYgABAAAAAAAGAAkAeAABAAAAAAAIABwAgQADAAEECQABABIAAAADAAEECQACAA4AEgADAAEECQADADAAIAADAAEECQAEABIAUAADAAEECQAFABYAYgADAAEECQAGAAkAeAADAAEECQAIABwAgQBNAGEAdABoACAARgBvAG4AdABSAGUAZwB1AGwAYQByAE0AYQB0AGgAcwAgAEYAbwByACAATQBvAHIAZQAgAE0AYQB0AGgAIABGAG8AbgB0AE0AYQB0AGgAIABGAG8AbgB0AFYAZQByAHMAaQBvAG4AIAAxAC4AME1hdGhfRm9udABNAGEAdABoAHMAIABGAG8AcgAgAE0AbwByAGUAAAMAAAAAAAAB9AD6AAAAAAAAAAAAAAAAAAAAAAAAAAC5BxEAAI2FGACyAAAAFRQTsQABPw%3D%3D)format('truetype')%3Bfont-weight%3Anormal%3Bfont-style%3Anormal%3B%7D%3C%2Fstyle%3E%3C%2Fdefs%3E%3Ctext%20font-family%3D%22Arial%22%20font-size%3D%2216%22%20font-style%3D%22italic%22%20text-anchor%3D%22middle%22%20x%3D%226.5%22%20y%3D%2216%22%3EH%3C%2Ftext%3E%3Ctext%20font-family%3D%22Arial%22%20font-size%3D%2212%22%20text-anchor%3D%22middle%22%20x%3D%2216.5%22%20y%3D%2221%22%3E0%3C%2Ftext%3E%3Ctext%20font-family%3D%22Arial%22%20font-size%3D%2216%22%20text-anchor%3D%22middle%22%20x%3D%2222.5%22%20y%3D%2216%22%3E%3A%3C%2Ftext%3E%3Ctext%20font-family%3D%22Arial%22%20font-size%3D%2216%22%20font-style%3D%22italic%22%20text-anchor%3D%22middle%22%20x%3D%2233.5%22%20y%3D%2216%22%3E%26%23x3BC%3B%3C%2Ftext%3E%3Ctext%20font-family%3D%22Arial%22%20font-size%3D%2212%22%20text-anchor%3D%22middle%22%20x%3D%2242.5%22%20y%3D%2221%22%3E1%3C%2Ftext%3E%3Ctext%20font-family%3D%22math1e73b84a23c3d1c1163dfc45bd2%22%20font-size%3D%2216%22%20text-anchor%3D%22middle%22%20x%3D%2258.5%22%20y%3D%2216%22%3E%3D%3C%2Ftext%3E%3Ctext%20font-family%3D%22Arial%22%20font-size%3D%2216%22%20font-style%3D%22italic%22%20text-anchor%3D%22middle%22%20x%3D%2275.5%22%20y%3D%2216%22%3E%26%23x3BC%3B%3C%2Ftext%3E%3Ctext%20font-family%3D%22Arial%22%20font-size%3D%2212%22%20text-anchor%3D%22middle%22%20x%3D%2284.5%22%20y%3D%2221%22%3E2%3C%2Ftext%3E%3Ctext%20font-family%3D%22Arial%22%20font-size%3D%2216%22%20font-style%3D%22italic%22%20text-anchor%3D%22middle%22%20x%3D%226.5%22%20y%3D%2245%22%3EH%3C%2Ftext%3E%3Ctext%20font-family%3D%22ae2ef524fbf3d9fe611d5a8e90fefdc%22%20font-size%3D%2212%22%20font-style%3D%22italic%22%20text-anchor%3D%22middle%22%20x%3D%2216.5%22%20y%3D%2250%22%3Ea%3C%2Ftext%3E%3Ctext%20font-family%3D%22Arial%22%20font-size%3D%2216%22%20text-anchor%3D%22middle%22%20x%3D%2222.5%22%20y%3D%2245%22%3E%3A%3C%2Ftext%3E%3Ctext%20font-family%3D%22Arial%22%20font-size%3D%2216%22%20font-style%3D%22italic%22%20text-anchor%3D%22middle%22%20x%3D%2233.5%22%20y%3D%2245%22%3E%26%23x3BC%3B%3C%2Ftext%3E%3Ctext%20font-family%3D%22Arial%22%20font-size%3D%2212%22%20text-anchor%3D%22middle%22%20x%3D%2242.5%22%20y%3D%2250%22%3E1%3C%2Ftext%3E%3Ctext%20font-family%3D%22math1e73b84a23c3d1c1163dfc45bd2%22%20font-size%3D%2216%22%20text-anchor%3D%22middle%22%20x%3D%2258.5%22%20y%3D%2245%22%3E%26%23x2260%3B%3C%2Ftext%3E%3Ctext%20font-family%3D%22Arial%22%20font-size%3D%2216%22%20font-style%3D%22italic%22%20text-anchor%3D%22middle%22%20x%3D%2275.5%22%20y%3D%2245%22%3E%26%23x3BC%3B%3C%2Ftext%3E%3Ctext%20font-family%3D%22Arial%22%20font-size%3D%2212%22%20text-anchor%3D%22middle%22%20x%3D%2284.5%22%20y%3D%2250%22%3E2%3C%2Ftext%3E%3C%2Fsvg%3E)
and assess the strength of evidence against the null hypothesis, as provided by our observed data, using a p-value. For simplicity, let’s assume a significance level (or type I error rate) of 5%. Our p-value is either:
- less than or equal to 5% (in which case we can reject the null hypothesis in favour of the alternative hypothesis and conclude that there is a difference between the two means)
or - greater than 5% (in which case we have insufficient evidence to reject the null hypothesis).
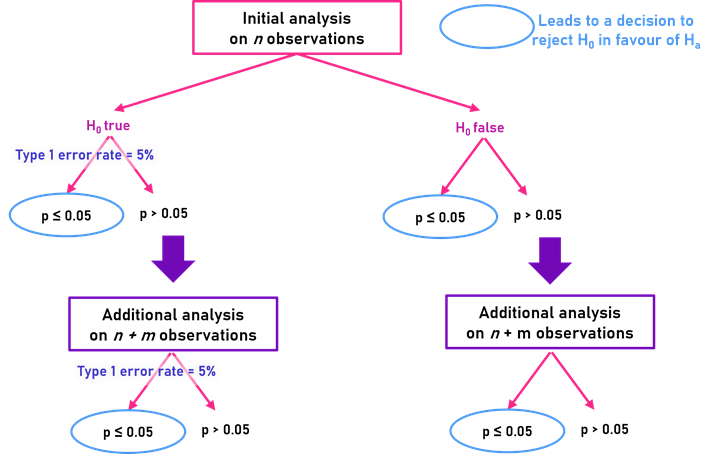
Under such a testing scenario, the probability that we reject the null hypothesis when in fact it is true is 5%. That is, there is a 5% probability of accepting the alternative hypothesis when the results can be attributed to chance.
As the authors I mention above have done, let’s “change the rules” of our test by adding some more data if the difference in means is promisingly large (or analogously, the p-value is small, but not quite small enough), and then having another go at rejecting the null hypothesis. Crucially, in doing so the probability that we erroneously reject the null hypothesis is no longer 5% - in fact, it is larger!
Intuitively, we can think of this as accumulating debt from our earlier test. Regardless of what happens next, there was a 5% probability of rejecting the null hypothesis by chance in the first analysis. And conversely, a 95% probability that the null hypotheses wasn’t rejected given that it is true. Adding more data, and re-analysing it doesn’t change these probabilities; we have already incurred a 5% type I error rate from the first analysis and this debt can’t be forgotten.
Why sequentially adding data is problematic
It’s perhaps more obvious to appreciate why sequentially adding more data until finally we have a data set that enables us to reject the null hypothesis is such a very bad thing to do. However, why adding a little bit more data to “give our analysis more power” is so wrong is possibly harder to wrap our heads around. But ultimately, it boils down to adding more data because we haven’t got the result we want. Hardly a fair approach!
So, what should have the authors done? Better approaches for robust results
Using the information from the initial analysis, the authors can conduct a power analysis to determine the sample size required to detect the effect of interest. Based on this sample size, the authors should then collect independent data (i.e., perform another experiment) and use this new data to test their hypothesis independently of the first data set.
Alternatively, the authors could have designed a priori a sequential analysis trial. Such an approach involves adjusting the significance level at each round of testing so that the overall type 1 error rate remains at the desired level. For example, for an overall type 1 error rate of 5%, and a maximum of two testing rounds, each test should be conducted at the 2.94% significance level (according to Pocock’s boundary). Sequential analysis is popular in clinical trials where, for ethical reasons, researchers want the option of stopping the trial early if the results from an initial group of patients provides the evidence they seek.
About the author
Dr. Vanessa Cave is an applied statistician interested in the application of statistics to the biosciences, in particular agriculture and ecology, and is a developer of the Genstat statistical software package. She has over 15 years of experience collaborating with scientists, using statistics to solve real-world problems. Vanessa provides expertise on experiment and survey design, data collection and management, statistical analysis, and the interpretation of statistical findings. Her interests include statistical consultancy, mixed models, multivariate methods, statistical ecology, statistical graphics and data visualisation, and the statistical challenges related to digital agriculture.
Vanessa is currently President of the Australasian Region of the International Biometric Society, past-President of the New Zealand Statistical Association, an Associate Editor for the Agronomy Journal, on the Editorial Board of The New Zealand Veterinary Journal and an honorary academic at the University of Auckland. She has a PhD in statistics from the University of St Andrew.
Popular


Related Reads