' fill='none' stroke='%23304560' stroke-miterlimit='10' stroke-width='2'/%3e%3c/svg%3e)

Optimizing statistical power: Designing effective experiments with Genstat
Dr. Roger Payne
22 September 2021
Genstat and ASReml are often used to analyse the results of experiments. We always hope that the analyses will lead to a satisfactory outcome, with accurate estimates of the interesting effects, and confident conclusions about the effectiveness of the treatments. Sometimes, however, the outcome may be less satisfactory. Our estimates may be too variable to provide any clear conclusions, and the time, resources and expense of the experiment may seem to have been wasted.
Minimizing the effects of random variation
Experiments will always be subject to random variation (the whims of nature!) but we can try to minimize the effects. You want to know that your experiment will be able to detect any biologically meaningful effects, and Genstat has menus to help.
To take a straightforward example, suppose we want to do an experiment to compare four diets. One is a control, representing current practice, and the other three are suggested alternatives. We plan to use a complete randomized-block design (i.e. a design with several "blocks" of subjects, each containing one subject receiving each of the diets), and the question is: How many blocks do we need?
Determining the number of blocks: a crucial decision
We can design the experiment using Genstat's menu to Generate a Standard Design. From the menu select Stats | Design | Generate a Standard Design.
This will be a one-way design in randomized blocks, with Subject as the factor to index the units in each block, and Diet as the treatment factor.
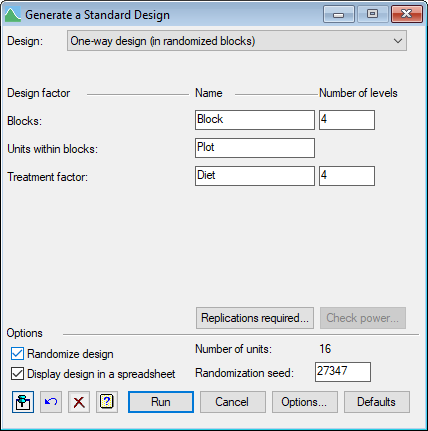
The menu loads with the assumption that we will want four blocks, but we can investigate this by clicking on the Replications required button.

Setting the stage: defining test parameters
We now need to think about what we want to achieve: how will we test the differences between the diets, and how confident do we want to be that the test will be successful. In the menu above, we are choosing to do a two-sided test with a significance level of 5%. Next we need to specify the size of difference that we want to detect in this way i.e. the smallest difference that would be worthwhile biologically (here 6, or perhaps minus 6 if this is a human experiment!) We need to specify the probability with which we would like to detect this difference (i.e. the power of the test).
Anticipating variability: estimating block variances
Finally, and this is the key question: how variable do we think that the experiment will be i.e. what do we expect to find as the variance between blocks? Ideally you should be able to get this from the residual mean square of the Block.Subject stratum of a similar previous experiment. If not, you will need to come up with a sensible prediction (and modify that in future when you see the results from this experiment). The menu also asks for the maximum feasible replication. Here we have left the default 20, although this is probably excessive.
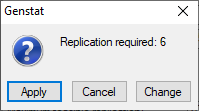
When we click OK, a menu pops up to tell us the required replication (here 6). If that is acceptable, we can click on Apply.
Generating an effective experiment: crafting the design
The number 6 is then entered into the field for the number of levels of the Block factor, and we can click on Run to generate the design. The default settings of the Options menu (not shown) print the design and a "skeleton" analysis of variance, from which we can see that there will be 15 residual degrees of freedom to compare the treatments.
First, the Replications required menu has shown the anticipated t-values at the various replications up to the maximum 20, then we have the design and the analysis of variance table.
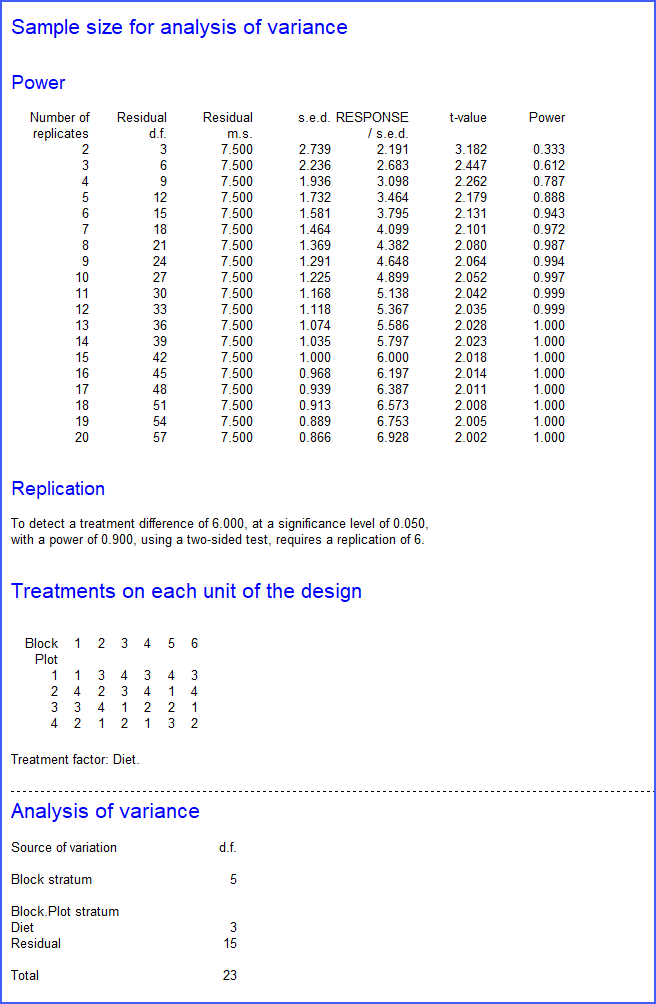
The menu also puts the design into a spreadsheet that, for example, you can save in Excel format to distribute to the experimenters. This is a very simple example - perhaps the simplest (though most common) design. However, the menu also covers all the other designs in the general Analysis of Variance menu.
About the author
Dr Roger Payne leads the development of Genstat at VSNi. He has a degree in mathematics and a PhD in mathematical statistics from University of Cambridge, and is a Chartered Statistician of the Royal Statistical Society.
Prior to joining VSNi he was a member of the Rothamsted Statistics Department, where he worked on Genstat from 1974, taking over its leadership in 1985. He has also had several extended research visits to other organisations, including a one year secondment to CSIRO Division of Mathematical Statistics in Adelaide during 1978-9. His work has involved a mixture of statistical computing, statistical consulting and research, enabling him to develop a talent for development and then practical application of new and relevant statistical methodology. He has a broad knowledge of statistics, with particular expertise in design and analysis of experiments, generalized linear models and linear mixed models.
He has served on the committees of many statistical societies, including the Royal Statistical Society Council, General Applications Section (Chairman) and Statistical Computing Section (Chairman), the British Classification Society and the International Association for Statistical Computing (Vice President). His other professional activities have included a visiting professorship at Liverpool John Moores University, and a special lectureship at University of Nottingham.
Popular


Related Reads