' fill='none' stroke='%23304560' stroke-miterlimit='10' stroke-width='2'/%3e%3c/svg%3e)

Using genetic correlations to improve the University of Florida's strawberry breeding program
Sujeet Verma, Luis Osorio, and Vance Whitaker
14 September 2021
The strawberry breeding program at the University of Florida develops cultivars for the 11,000 acre Florida industry and for winter and spring production regions globally. The program is more than seventy years old, and for the majority of its history was based on phenotypic recurrent selection. Most selection was based on visual characteristics and tasting of fruit, while limited data was collected on yield and diseases. In the last decade the program has supplemented these methods with an expansion of data collection for various traits, more sophisticated experimental designs for clonally-replicated trials, and the use of quantitative genetics to inform selection decisions. ASReml software has been key to this transformation.
We have been using ASReml since 2010 for the estimation of genetic variances, genotype-by-environment (G × E) interactions, and genetic correlations among the traits of interest. In addition, ASReml-R has provided a flexible platform for genomic prediction. The following are specific descriptions of the ways ASReml has been used in our strawberry breeding program.
Unleashing the power of spatial analysis
Spatial analysis can improve the estimation of genetic effects by modelling more accurately the spatial distribution of error effects in a field. Like all plant breeders we try our best to select and prepare homogeneous field sites, but there is always heterogeneity within a plot due to issues such as soil type, water distribution, nutrient distribution, etc. Standard methods like RCBD may not work well when the number of blocks and/or test genotypes become larger. Spatial analysis exploits correlations between rows and columns to adjust for heterogeneity. It is difficult to know all trends in heterogeneity because some, such as soil type, may be there before planting and others might appear after planting due to management and data collection. Spatial analysis, using row-column alpha design, allows blocking in both the row and column directions for pairwise entry comparisons. We don’t recommend solely using spatial analysis: rather, one must use both RCBD/IBD and spatial analysis as post-hoc analysis.
Peering into the field: Variogram plot insights
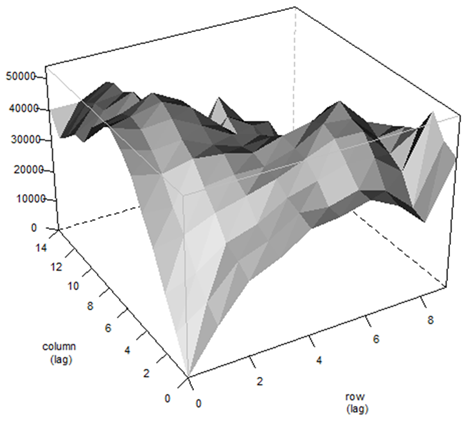 |
| A typical variogram plot from AR1⊗AR1 model using ASReml-R. |
At University of Florida, we started using spatial analysis about five years ago with the aim of improving our genomic predictions by correcting the input phenotypic data for spatial effects. We test different models for each trait of interest including, but not limited to:
- The use of residual variance structures (AR1⊗AR1)
- spline models
- phenotypic data adjustments by the experimental factors. We use several statistics including loglikelihood, AIC, BIC, MSE and the F-test for fixed effects to compare models and select the model with the best fit to the data. We perform these procedures in ASReml-SA (standalone); however, they can be easily performed in ASReml-R as well.
Genomic Best Linear Unbiased Prediction (gBLUP)
One of our first goals in using ASReml was to select parents based on breeding values where available, in addition to phenotypes. We first began calculating BLUPs using pedigrees, and then after a couple of years transitioned to gBLUP once genome-wide markers were available across the breeding program. We use the “predict” function to predict BLUP values and “coef. random” to extract BLUP values. We also estimate BLUE values for fixed effects.
Looking into genetic relationships: population structure analysis
We have recently started using the VSNi-developed R package, ASRgenomics, for our genomic selection pipeline. In the process we have sometimes encountered issues of singularities. The “kinship. diagnonostic” tools within the ASRgenomics R package enables us to visualize diagonal and off-diagonal values of the relationship matrix and helps identify potential duplicate clones that are causing singularities issues. Higher diagonal values indicate higher inbreeding, and a larger off-diagonal value indicates potential similarity issues within a dataset.
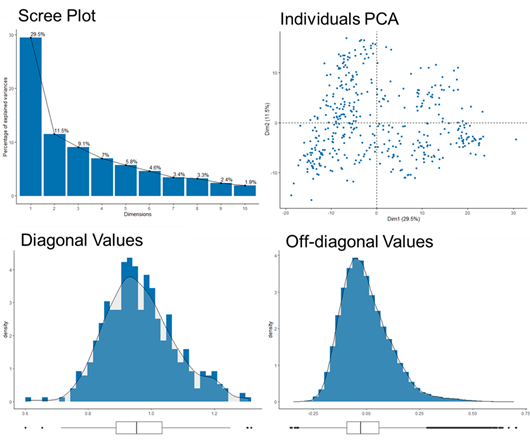 |
| ASRgenomics diagnostic plots. The scree plot indicates that the first 10 PCs can explain nearly 100% of genetic diversity, with the first 3 PCs explaining ~ 50% of diversity. The individuals PCA plot visualizes clusters of individuals and the distance between them. The bottom plots show the distributions of diagonal and off-diagonal values from a relationship matrix. |
Other features in ASRgenomics that have been useful are PCA and scree plots for examining germplasm diversity. In addition, a dendrogram heatmap of a relationship matrix can help visualise sub-population structures.
| Additive | Dominance |
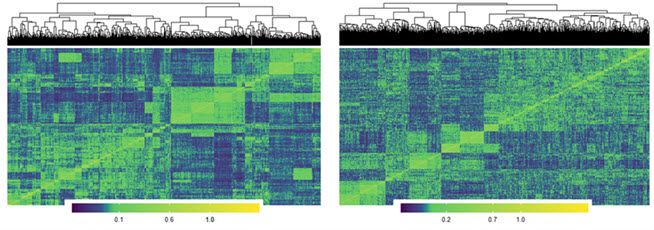 | |
| Visualization of a relationship matrix: additive and dominance. Y-axis represents individuals and X-axis represents markers. | |
Genotype × Environment Interactions (G × E): Decoding the puzzle
Performance of a selection in different environments is key to developing and deploying strawberry varieties. We use ASReml to estimate G × E effects via type b correlations.
Naviating the web of genetic correlations
Genetic correlations, also known as correlations among breeding values among traits, vary in magnitude and direction from negative correlations to positive correlations, and play a significant role in our breeding strategy and estimation of prediction accuracy in genomic selection. They are important because if the traits are strongly correlated, the following scenarios might occur:
(1) selection on one trait might cause a change in the other trait
(2) performance of an easy to measure trait can help to predict the breeding values of a costly or difficult to measure trait
(3) in genomic selection the predictive ability of a low-heritability trait can be increased by its genetic correlation with a highly heritable trait.
One example is the correlation of solid soluble content (SSC or brix) and marketable yield which are strong and negatively correlated in our breeding program. In this case, to avoid selecting individuals with low breeding values for either SSC or marketable yield, we look for genotypes that have high breeding values for both traits, also known as “correlation breakers” or select individuals that reach minimum threshold breeding values set in the program. We use selection indices to improve the predictive ability of breeding values and rank phenotypes for selection.
Modeling the complexities: Additive, dominance, and epistasis
One of the major advantages of gBLUP using ASReml is the ability to build a complex statistical model combining relationships matrices based on additive, dominance, and epistasis effects. We have estimated dominance effects for some trials. Nevertheless, we have found that additive models work best for genomic prediction thus far.
Unveiling the influence: Fixed effects in mixed model analyses
One major advantage of ASReml is that it allows the addition of QTL as fixed effects in the mixed model analyses. Later a simple Wald test can suggest whether the fixed effect was significant or not, and whether it affected variance component estimates overall. While we have not yet found a trait or situation in which adding a fixed effect for a QTL has increased predictive ability, we are continuing to explore this approach.
Conclusions
ASReml has been invaluable to the evolution of our breeding program. Indeed, over the last decade it has become an integral part of our breeding pipeline. The ability to perform spatial analyses, generate and predict breeding values, examine population structures, and estimate G × E and genetic correlations have led to real-world applications in our breeding program that are helping us to develop better strawberry varieties.
About the authors
Dr Sujeet Verma is a statistical and molecular geneticist at the University of Florida working for the strawberry breeding program. He enjoys analysing large genotypic and phenotypic datasets and is passionate about quantitative genetics and finding genetic solutions for breeders. Linkedin profile Sujeet Verma
Dr Luis Osorio is a highly experienced research professional at the University of Florida. He is part of the research team working for the strawberry breeding program. His main research interests include Genomic Selection, Phenomics and climate change impact on breeding populations. Linkedin profile Luis Osorio
Dr. Vance Whitaker is an Associate Professor of Horticulture at the University of Florida. Dr. Whitaker develops strawberry varieties for the university and his breeding program is enhanced through genetic research and collaborations. Linkedin profile Vance Whitaker
Popular


Related Reads