' fill='none' stroke='%23304560' stroke-miterlimit='10' stroke-width='2'/%3e%3c/svg%3e)

What’s the difference between an SD and an SEM?
The VSNi Team
16 May 2022
When choosing which error bar to plot, keep the following in mind: the SD is a descriptive statistic that informs us about the variability of our data. Thus, you should use the SD as your error bar when you want to describe how spread-out the values in your dataset are.
On the other hand, the SEM is associated with inferential statistics. It reflects the uncertainty in the mean and depends on the sample size. Thus, you should use the SEM as your error bar when making inferences (i.e., drawing conclusions) about the population mean.
Standard Deviations (SD)vsStandard Error of the MEAN (SEM) | |
Definition | SD is a measure of the variability of the data SEM is a measure of the precision with which the sample mean estimates the population mean |
Formula |
|
Increasing sample size |
SD → unchanged
SEM → decreases |
Comparison | The SEM is always smaller than the SD |


Example
Imagine we are interested in estimating grain yield per plant on our farm. We randomly select a sample of n plants, and for each, measure its yield .
Now, imagine that we repeat this random sampling process several times (for arguments sake, another 3 times). From each of our random samples (a, b, c, d), we can estimate the mean grain yield per plant ( ) This estimate of mean yield will vary between the samples. The SEM estimates this variability. The lower the SEM, the more precise our estimate of the population mean is. Conversely, the SD is a measure of the spread or variability of the data.
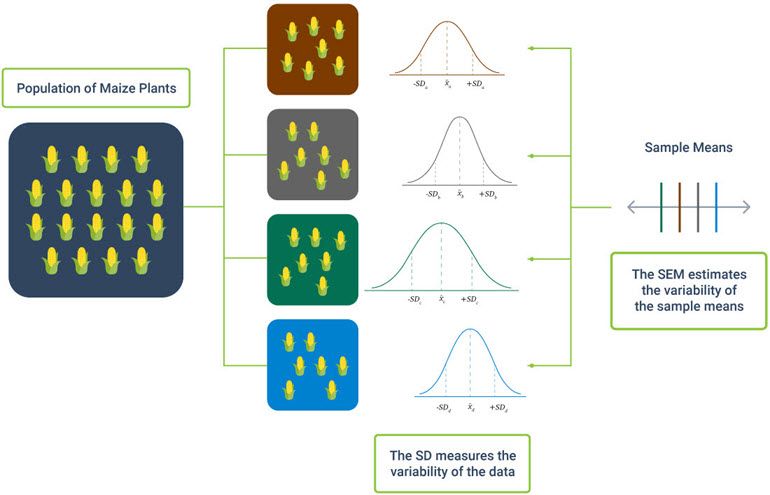
Popular


Related Reads