' fill='none' stroke='%23304560' stroke-miterlimit='10' stroke-width='2'/%3e%3c/svg%3e)

Decoding the p-value: what statisticians need to know
The VSNi Team
04 May 2021
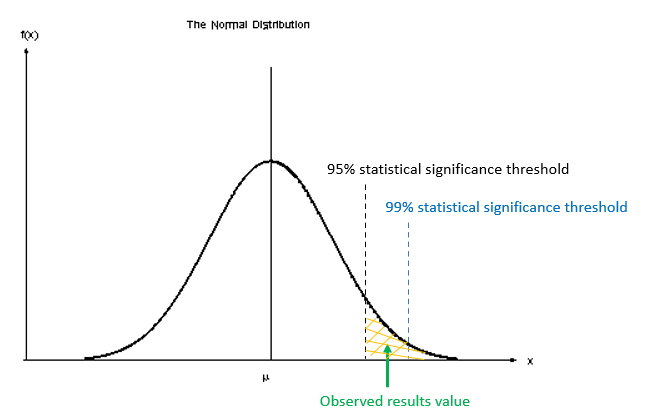
A way to decide whether to reject the null hypothesis (H0) against our alternative hypothesis (H1) is to determine the probability of obtaining a test statistic at least as extreme as the one observed under the assumption that H0 is true. This probability is referred to as the “p-value”. It plays an important role in statistics and is critical in most biological research.
What is the true meaning of a p-value and how should it be used?
P-values are a continuum (between 0 and 1) that provide a measure of the strength of evidence against H0. For example, a value of 0.066, will indicate that there is a probability that we could observe values as large or larger than our critical value with a probability of 6.6%. Note that this p-value is NOT the probability that our alternative hypothesis is correct, it is only a measure of how likely or unlikely we are to observe these extreme events, under repeated sampling, in reference to our calculated value. Also note that this p-value is obtained based on an assumed distribution (e.g., t-distribution for a t-test); hence, p-value will depend strongly on your (correct or incorrect) assumptions.
The smaller the p-value, the stronger the evidence for rejecting H0. However, it is difficult to determine what a small value really is. This leads to the typical guidelines of: p < 0.001 indicating very strong evidence against H0, p < 0.01 strong evidence, p < 0.05 moderate evidence, p < 0.1 weak evidence or a trend, and p ≥ 0.1 indicating insufficient evidence [1], and a strong debate on what this threshold should be. But declaring p-values as being either significant or non-significant based on an arbitrary cut-off (e.g. 0.05 or 5%) should be avoided. As Ronald Fisher said:
“_No scientific worker has a fixed level of significance at which, from year to year, and in all circumstances he rejects hypotheses; he rather gives his mind to each particular case in the light of his evidence and his ideas_”. [2].
A very important aspect of the p-value is that it does not provide any evidence in support of H0 – it only quantifies evidence against H0. That is, a large p-value does not mean we can accept H0. Take care not to fall into the trap of accepting H0! Similarly, a small p-value tells you that rejecting H0 is plausible, and not that H1 is correct!
For useful conclusions to be drawn from a statistical analysis, p-values should be considered alongside the size of the effect. Confidence intervals are commonly used to describe the size of the effect and the precision of its estimate. Crucially, statistical significance does not necessarily imply practical (or biological) significance. Small p-values can come from a large sample and a small effect, or a small sample and a large effect.
It is also important to understand that the size of a p-value depends critically on the sample size (as this affects the shape of our distribution). Here, with a very very large sample size, H0 may be always rejected even with extremely small differences, even if H0 is nearly (i.e., approximately) true. Conversely, with very small sample size, it may be nearly impossible to reject H0 even if we observed extremely large differences. Hence, p-values need to also be interpreted in relation to the size of the study.
References
[1] Ganesh H. and V. Cave. 2018. P-values, P-values everywhere! New Zealand Veterinary Journal. 66(2): 55-56.
[2] Fisher RA. 1956. Statistical Methods and Scientific Inferences. Oliver and Boyd, Edinburgh, UK.
Popular


Related Reads