' fill='none' stroke='%23304560' stroke-miterlimit='10' stroke-width='2'/%3e%3c/svg%3e)

The evolution of statistical computing: a captivating journey through history
The VSNi Team
27 April 2021
It is widely acknowledged that the most fundamental developments in statistics in the past 60+ years are driven by information technology (IT). We should not underestimate the importance of pen and paper as a form of IT but it is since people start using computers to do statistical analysis that we really changed the role statistics plays in our research as well as normal life.
In this blog we will give a brief historical overview, presenting some of the main general statistics software packages developed from 1957 onwards. Statistical software developed for special purposes will be ignored. We also ignore the most widely used ‘software for statistics’ as Brian Ripley (2002) stated in his famous quote: “Let’s not kid ourselves: the most widely used piece of software for statistics is Excel.” Our focus is some of the packages developed by statisticians for statisticians, which are still evolving to incorporate the latest development of statistics.
Ronald Fisher’s calculating machines
Pioneer statisticians like Ronald Fisher started out doing their statistics on pieces of paper and later upgraded to using calculating machines. Fisher bought the first Millionaire calculating machine when he was heading Rothamsted Research’s statistics department in the early 1920s. It cost about £200 at that time, which is equivalent in purchasing power to about £9,141 in 2020. This mechanical calculator could only calculate direct product, but it was very helpful for the statisticians at that time as Fisher mentioned: "Most of my statistics has been learned on the machine." The calculator was heavily used by Fisher’s successor Frank Yates (Head of Department 1933-1968) and contributed to much of Yates’ research, such as designs with confounding between treatment interactions and blocks, or split plots, or quasi-factorials.
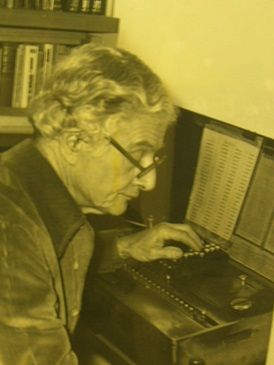
Frank Yates
Rothamsted Annual Report for 1952: "The analytical work has again involved a very considerable computing effort."
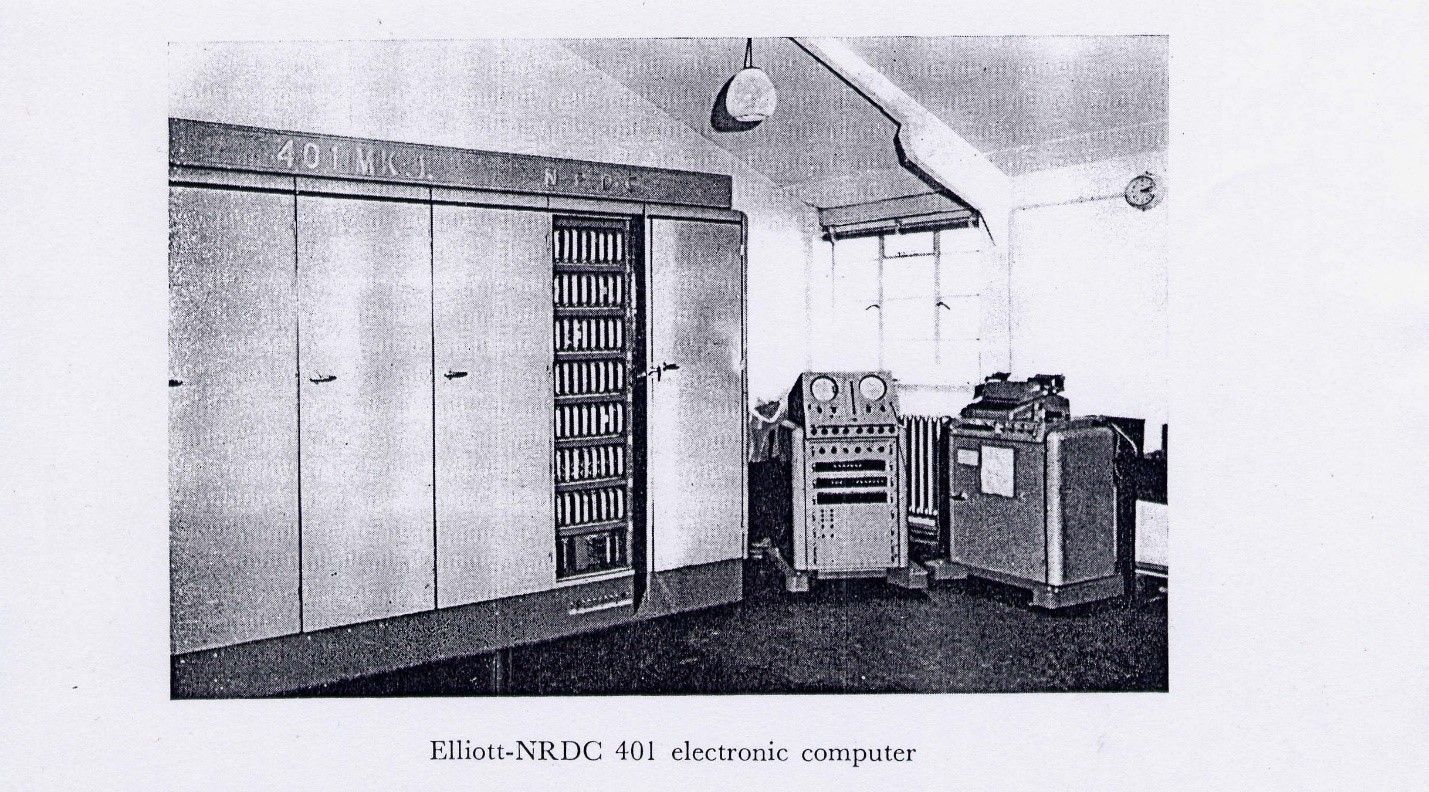
Beginning of the computer age
From the early 1950s we entered the computer age. The computer at this time looked little like its modern counterpart, whether it was an Elliott 401 from the UK or an IBM 700/7000 series in the US. Although the first documented statistical package, BMDP, was developed starting in 1957 for IBM mainframes at the UCLA Health Computing Facility, on the other side of the Atlantic Ocean statisticians at Rothamsted Research began their endeavours to program on an Elliot 401 in 1954.
Programming statistical software
When we teach statistics in schools or universities, students very often complain about the difficulties of programming. Looking back at programming in the 1950s will give modern students an appreciation of how easy programming today actually is!
An Elliott 401 served one user at a time and requested all input on paper tape (forget your keyboard and intelligent IDE editor). It provided the output to an electric typewriter. All programming had to be in machine code with the instructions and data on a rotating disk with 32-bit word length, 5 "words" of fast-access store, 7 intermediate access tracks of 128 words, 16 further tracks selectable one at a time (= 2949 words – 128 for system).

Computer paper tape
fitting constants to main effects and interactions in multi-way tables (1957), regression and multiple regression (1956), fitting many standard curves as well as multivariate analysis for latent roots and vectors (1955).
Although it sounds very promising with the emerging of statistical programs for research, routine statistical analyses were also performed and these still represented a big challenge, at least computationally. For example, in 1963, which was the last year with the Elliott 401 and Elliott 402 computers, Rothamsted Research statisticians analysed 14,357 data variables, and this took them 4,731 hours to complete the job. It is hard to imagine the energy consumption as well as the amount of paper tape used for programming. Probably the paper tape (all glued together) would be long enough to circle the equator.
Development of statistical software: Genstat, SAS, SPSS
The above collection of programs was mainly used for agricultural research at Rothamsted and was not given an umbrella name until John Nelder became Head of the Statistics Department in 1968. The development of Genstat (General Statistics) started from that year and the programming was done in FORTRAN, initially on an IBM machine. In that same year, at North Carolina State University, SAS (Statistical Analysis Software) was almost simultaneously developed by computational statisticians, also for analysing agricultural data to improve crop yields. At around the same time, social scientists at the University of Chicago started to develop SPSS (Statistical Package for the Social Sciences). Although the three packages (Genstat, SAS and SPSS) were developed for different purposes and their functions diverged somewhat later, the basic functions covered similar statistical methodologies.
The first version of SPSS was released in 1968. In 1970, the first version of Genstat was released with the functions of ANOVA, regression, principal components and principal coordinate analysis, single-linkage cluster analysis and general calculations on vectors, matrices and tables. The first version of SAS, SAS 71, was released and named after the year of its release. The early versions of all three software packages were written in FORTRAN and designed for mainframe computers.
Since the 1980s, with the breakthrough of personal computers, a second generation of statistical software began to emerge. There was an MS-DOS version of Genstat (Genstat 4.03) released with an interactive command line interface in 1980.
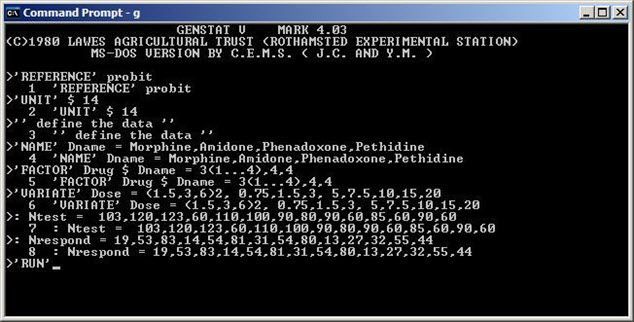
Genstat 4.03 for MSDOS
Around 1985, SAS and SPSS also released a version for personal computers. In the 1980s more players entered this market: STATA was developed from 1985 and JMP was developed from 1989. JMP was, from the very beginning, for Macintosh computers. As a consequence, JMP had a strong focus on visualization as well as graphics from its inception.
The rise of the statistical language R
The development of the third generation of statistical computing systems had started before the emergence of software like Genstat 4.03e or SAS 6.01. This development was led by John Chambers and his group in Bell Laboratories since the 1970s. The outcome of their work is the S language. It had been developed into a general purpose language with implementations for classical as well as modern statistical inferences. S language was freely available, and its audience was mainly sophisticated academic users. After the acquisition of S language by the Insightful Corporation and rebranding as S-PLUS, this leading third generation statistical software package was widely used in both theoretical and practical statistics in the 1990s, especially before the release of a stable beta version of the free and open-source software R in the year 2000. R was developed by Ross Ihaka and Robert Gentleman at the University of Auckland, New Zealand, and is currently widely used by statisticians in academia and industry, together with statistical software developers, data miners and data analysts.
Software like Genstat, SAS, SPSS and many other packages had to deal with the challenge from R. Each of these long-standing software packages developed an R interface R or even R interpreters to anticipate the change of user behaviour and ever-increasing adoption of the R computing environment. For example, SAS and SPSS have some R plug-ins to talk to each other. VSNi’s ASReml-R software was developed for ASReml users who want to run mixed model analysis within the R environment, and at the present time there are more ASReml-R users than ASReml standalone users. Users who need reliable and robust mixed effects model fitting adopted ASReml-R as an alternative to other mixed model R packages due to its superior performance and simplified syntax. For Genstat users, msanova was also developed as an R package to provide traditional ANOVA users an R interface to run their analysis.
What’s next?
We have no clear idea about what will represent the fourth generation of statistical software. R, as an open-source software and a platform for prototyping and teaching has the potential to help this change in statistical innovation. An example is the R Shiny package, where web applications can be easily developed to provide statistical computing as online services. But all open-source and commercial software has to face the same challenges of providing fast, reliable and robust statistical analyses that allow for reproducibility of research and, most importantly, use sound and correct statistical inference and theory, something that Ronald Fisher will have expected from his computing machine!
Popular


Related Reads