' fill='none' stroke='%23304560' stroke-miterlimit='10' stroke-width='2'/%3e%3c/svg%3e)

Significance levels: a love-hate relationship
Dr. Salvador A. Gezan
02 March 2022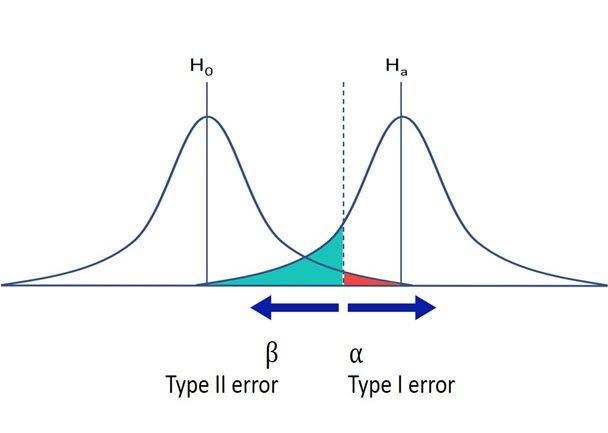
The significance level debate
We frequently hear in the scientific community a debate in favour of or against the use of p-values for statistical testing. The focus of this note is not to contribute (or muddle) this debate, but just to bring attention to a couple of elements critical to understanding the concept of the significance level. We will focus on three keywords: convention, trade-off and risk.
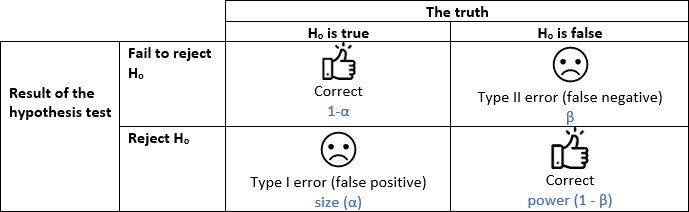
Recall that significance level refers to that value, say α = 0.05, that we use to decide if we should reject a null hypothesis (e.g., no difference in the means between two treatments). This α value represents the proportion of mistakes (here 5%) that we will make when we reject the null hypothesis when in fact it is true. This type I error, implies that we declare two means significantly different when in fact they are not (an undesirable situation with a false positive). Recall that we also have type II error, or β, the case in which we do not declare two means significantly different when in fact they are (another undesirable situation). This last error is associated with the power of a test, but here we will only focus on the controversial α value.
Understanding the convention of significance levels
Let’s start with the keyword convention. Depending on the field, we use different significance levels to ‘dictate’ when a test result is significant. Often, we use 0.10, 0.05 or 0.01; the use of a higher value usually is associated with scientific fields where there are greater levels of uncertainty (e.g., ecology), whereas stricter (lower) values are used in medical or pharmaceutical studies.
The story behind the 0.05 significance level
Without a doubt, the most common value used is 0.05: but why this value and what does it mean? This value, as indicated earlier, indicates that if the null hypothesis is true, we will only reject it wrongly 5% of the time (or 1 in 20 times). This seems a reasonable number, but a somehow arbitrary choice. This significance level originated from the tables of critical values reported by Fisher and Yates back in 1938 and this value has stayed as a convenient number. (However, they also reported 0.10, 0.02, 0.01, 0.002 and 0.001). In part these significance levels were chosen by the above authors given their limitations to calculate all possible probabilities. Now, we usually get p-values instead of critical values, but interestingly, we still focus on that historical reference of 5%.
Reevaluating the arbitrary nature of significance levels
The convenient and arbitrary choice of a 5% significance level has now become a convention. But there is no scientific or empirical reasoning for the use of this or any other value. This is one of the reasons for the present debate on its use. It also seems odd that, for example, when α is 0.05 we declare a test significant with a p-value of 0.047, but not significant if this p-value is 0.053. As you can see this enhances its arbitrary nature, and maybe we should focus on the strength of the evidence against our null hypothesis, namely, talking about mild or strong significance in our results, instead of a yes/no attitude.
The trade-off in choosing significance levels
The second keyword is trade-off. In any decision, even in the simplest life decisions, there is always the possibility of making some mistakes. If, for your statistical inference, you are unwilling to make almost any mistakes, then you should select a very small value: an α, say of 0.0001 (here, 1 in 10,000 times you will make the wrong decision). This, at first glance, seems reasonable, but it has other implications. Requiring a very high level of confidence will mean that you will almost never reject the null hypothesis even if rejecting it is the correct decision! This occurs because you are setting up very strict thresholds to report a significant result and therefore you need extremely strong evidence.
Balancing conservatism and scientific advancement
The above conservative philosophy results in two side effects. First, a waste of resources as you are extremely unlikely to report significant differences from almost any study you might execute; only those with extremely large effects (or sample sizes) will have sufficient power. Second, the scientific advancement in terms of discoveries (for example, a new drug or treatment) will be hampered by these strict values. For example, we will have fewer drugs or treatments available for some illnesses. Here, it is the society as a whole that loses in progress and scientific advancement with such a high threshold.
Flexible significance levels and false positives
On the other hand, something different, but also concernin, occurs with a very flexible significance level (say α = 0.30). Here we are very likely to find a ‘better’ drug or treatment, but these are not necessarily true improvements as we are likely having too many false positives with results almost random. This too has strong side effects for all of us such as: 1) a large societal cost on having drugs or treatments that are not necessarily better than the original ones (even if we think they are), and 2) it will be hard, as an individual, to discriminate between the good and the bad drugs (or treatments) as there are too many ‘good’ options available and all are reported as the ‘best’ ones!
This is where there exists a trade-off between too much or too little; individuals and societies need to define what is an adequate level of mistakes. Somehow it seems the scientific community has chosen 0.05! But any value will be always good or bad depending on the above trade-offs.
Defining an adequate level of risk
The last keyword is risk. Any decision that involves a mistake implies a risk. This is better understood with a few examples. So, imagine that you are considering using an alternative drug to treat your chronic disease that potentially has some bad, but manageable, side effects. In this case, you might want stronger evidence that this drug is going to be better than the standard; hence, you might want to use an α of 0.0001, to make sure it is better (at least statistically). Hence, under potentially high personal risk of a bad decision, the significance level required has to be lower.
In contrast, imagine that you want to use the seeds of an alternative tomato variety that has been recommended to you for planting in your garden. The risk of having the wrong genetic source is ever present, and it will imply a waste of resources (money, time and frustration); but, under failure, your risk is relatively low, as you can buy tomatoes from the supermarket and the following year, go back to the seeds of your typical (and well tested) variety. In this case, the personal risk is relatively low, and you might be happy with an α of 0.10 (implying 1 in 10 times you will be incorrect) to give a chance to this alternative variety.
Hence, it is difficult to define what is an adequate level of risk for our decisions, an aspect that is also subjective. And once more, it seems that the scientific community has decided that 5% is a good level of risk!
In summary, significance levels are a convention that we have carried for a while but going forward we need to be flexible and critical on how they are used and reported. In many senses they are subjective decisions, and we could even say they are individual decisions that take into consideration our personal like or dislike of risks and the potential trade-off in taking the right or wrong decisions. So, next time you see a p-value take a step back and think about the consequences!
About the Author
Salvador Gezan is a statistician/quantitative geneticist with more than 20 years’ experience in breeding, statistical analysis and genetic improvement consulting. He currently works as a Statistical Consultant at VSN International, UK. Dr. Gezan started his career at Rothamsted Research as a biometrician, where he worked with Genstat and ASReml statistical software. Over the last 15 years he has taught ASReml workshops for companies and university researchers around the world.
Dr. Gezan has worked on agronomy, aquaculture, forestry, entomology, medical, biological modelling, and with many commercial breeding programs, applying traditional and molecular statistical tools. His research has led to more than 100 peer reviewed publications, and he is one of the co-authors of the textbook “Statistical Methods in Biology: Design and Analysis of Experiments and Regression”.
Popular


Related Reads