' fill='none' stroke='%23304560' stroke-miterlimit='10' stroke-width='2'/%3e%3c/svg%3e)

Further inference from an ANOVA table: residual variance to standard errors and confidence intervals
Dr. Vanessa Cave
31 May 2022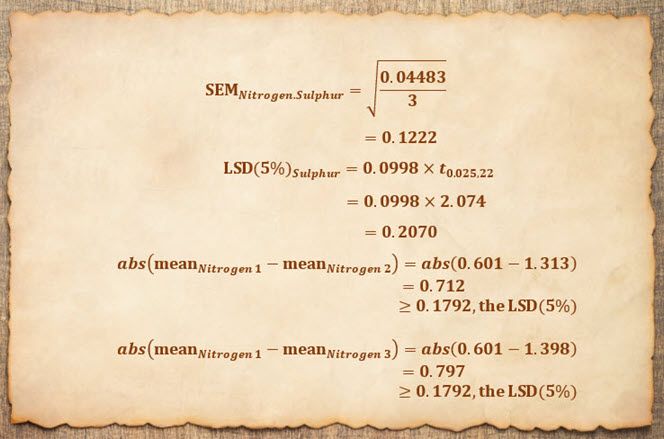
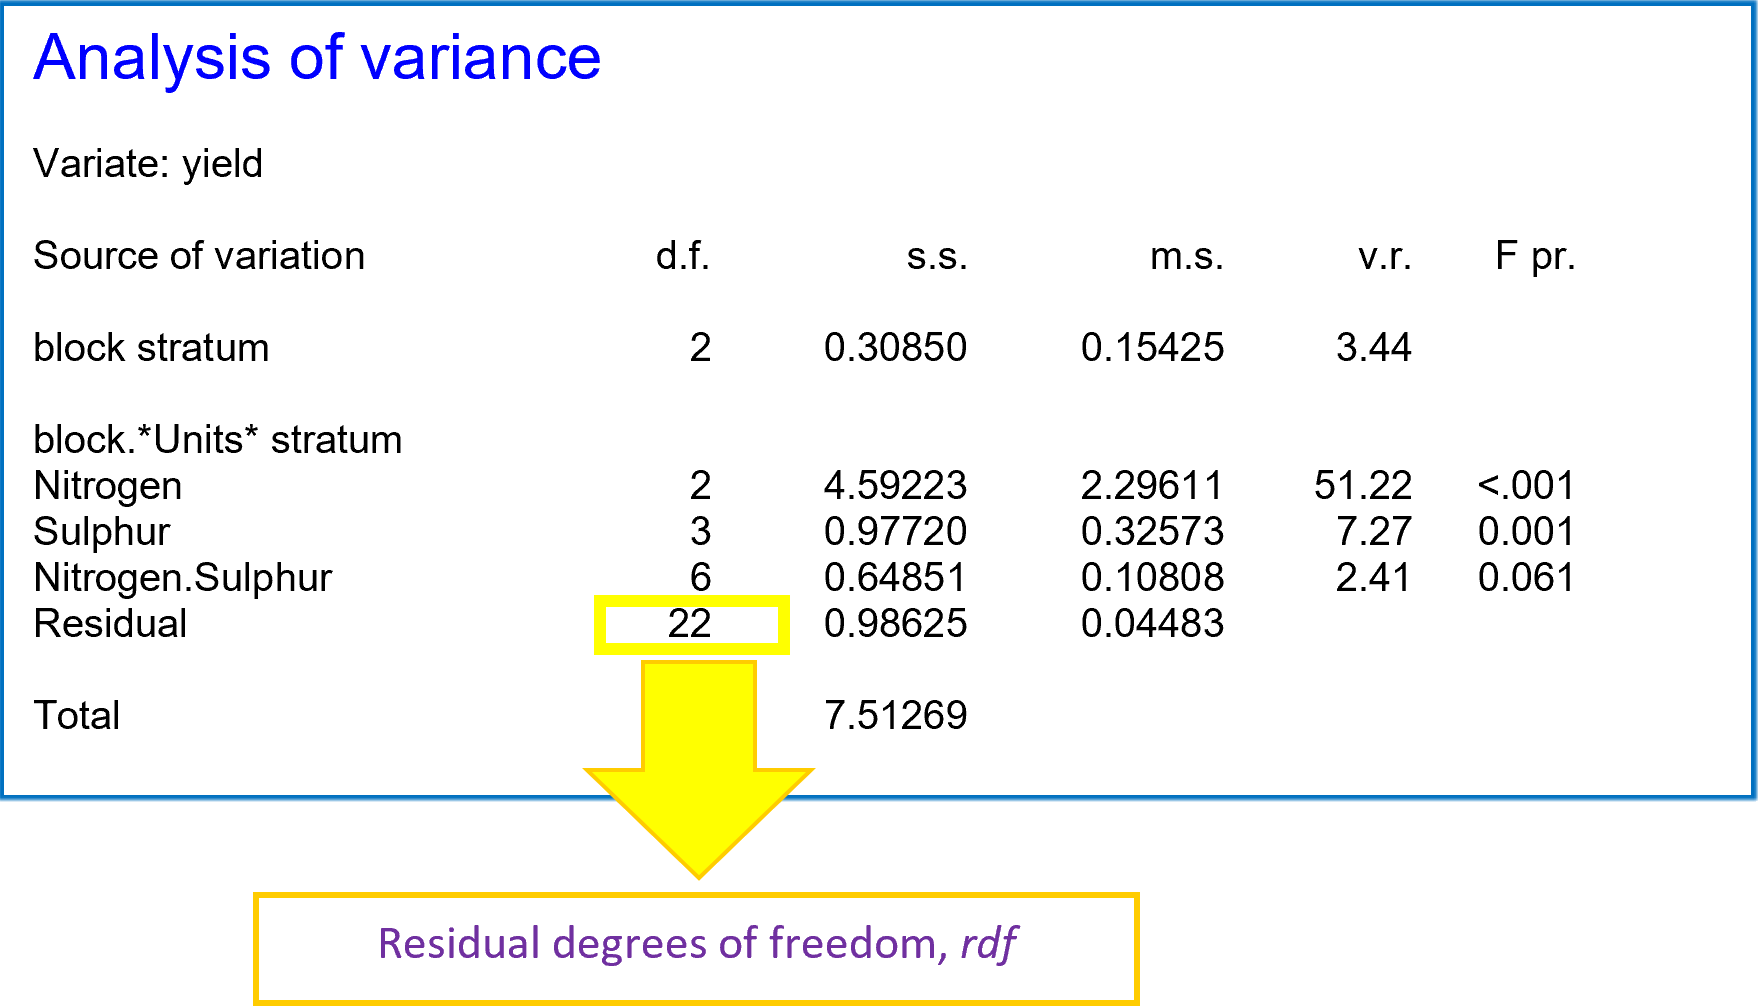
Below is an example of a 2-way Analysis of Variance (ANOVA) for a randomised complete block design. From the ANOVA table, we’re going to see how to calculate:
- The standard error of a mean (SEM).
- The confidence interval (CI) for a mean.
- The standard error of the difference between two means (SED).
- The least significant difference between two means (LSD).
- The confidence interval for the difference between two means.
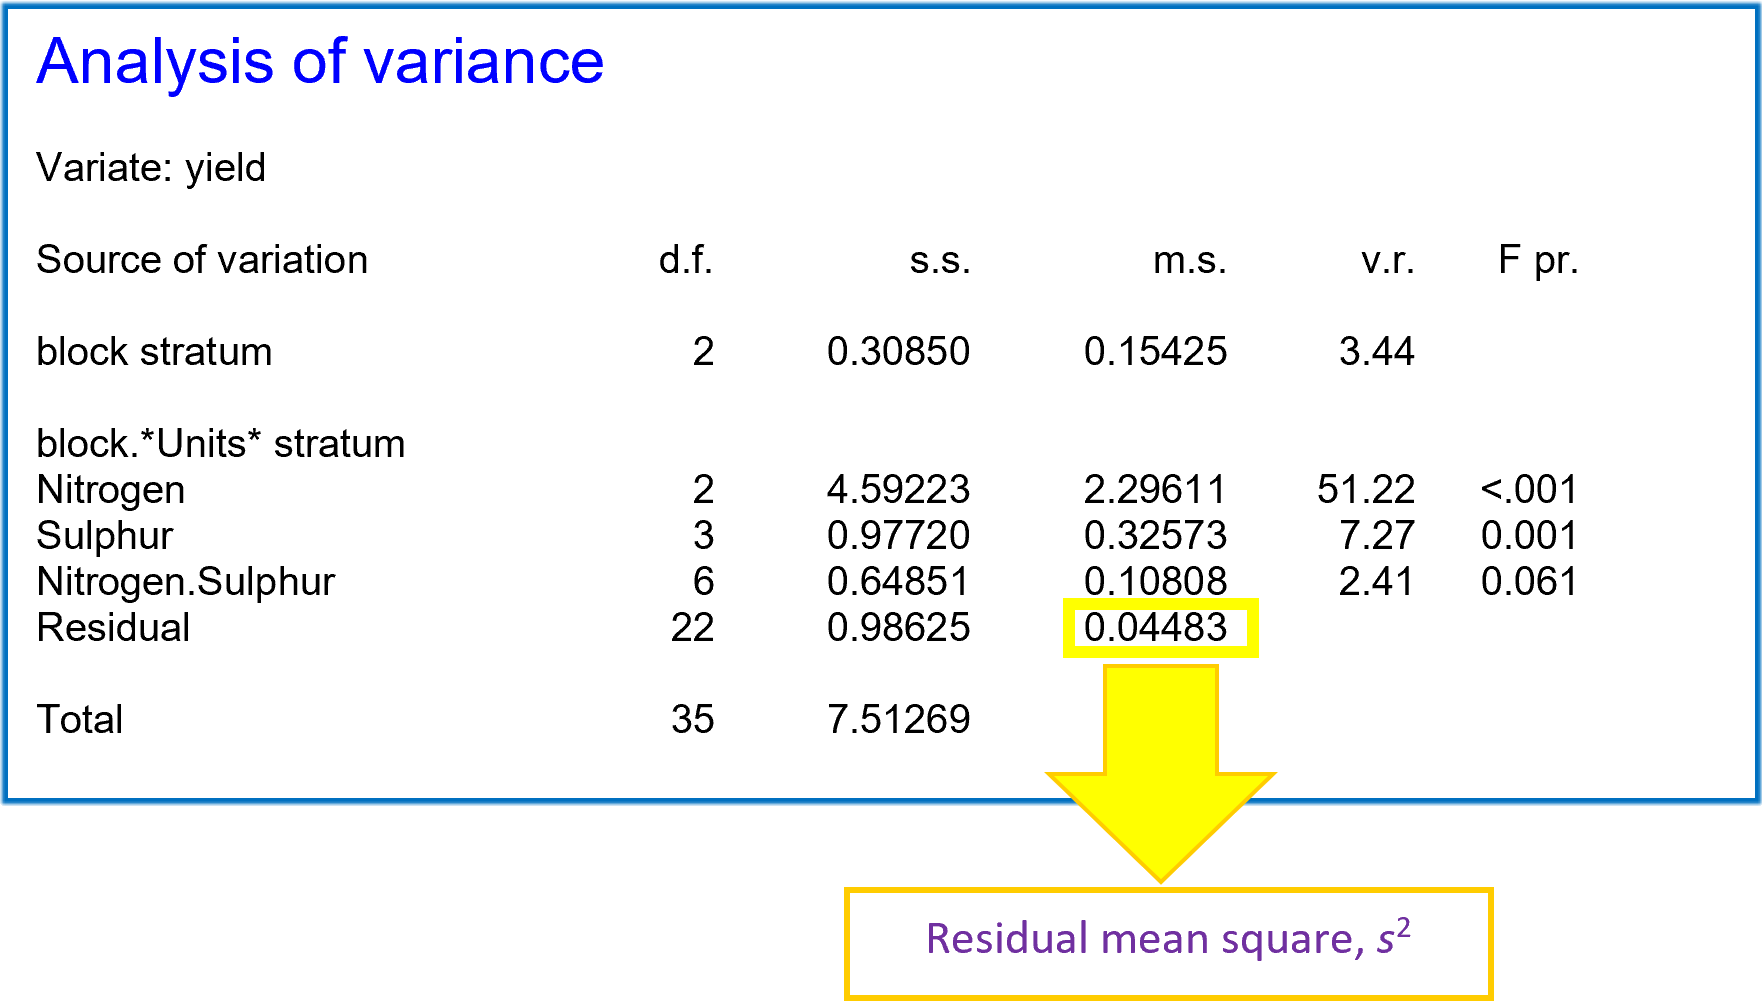
Understanding residual mean square
The ANOVA table gives us an estimate of the residual mean square () – also known as the mean square error, residual error or residual variation. This is the variation in the data unexplained by the ANOVA model. In the example above, this is the variation remaining after the block effects (block) and treatment effects (Nitrogen, Sulphur and the Nitrogen by Sulphur interaction, Nitrogen.Sulphur) have been accounted for.
Calculating standard error of a mean (sem)
The standard error of a mean (SEM) is calculated using the following formula:
format('truetype')%3Bfont-weight%3Anormal%3Bfont-style%3Anormal%3B%7D%3C%2Fstyle%3E%3C%2Fdefs%3E%3Ctext%20font-family%3D%22Arial%22%20font-size%3D%2216%22%20font-style%3D%22italic%22%20text-anchor%3D%22middle%22%20x%3D%225.5%22%20y%3D%2233%22%3ES%3C%2Ftext%3E%3Ctext%20font-family%3D%22Arial%22%20font-size%3D%2216%22%20font-style%3D%22italic%22%20text-anchor%3D%22middle%22%20x%3D%2216.5%22%20y%3D%2233%22%3EE%3C%2Ftext%3E%3Ctext%20font-family%3D%22Arial%22%20font-size%3D%2216%22%20font-style%3D%22italic%22%20text-anchor%3D%22middle%22%20x%3D%2228.5%22%20y%3D%2233%22%3EM%3C%2Ftext%3E%3Ctext%20font-family%3D%22math17f39f8317fbdb1988ef4c628eb%22%20font-size%3D%2216%22%20text-anchor%3D%22middle%22%20x%3D%2248.5%22%20y%3D%2233%22%3E%3D%3C%2Ftext%3E%3Cpolyline%20fill%3D%22none%22%20points%3D%2212%2C-42%2011%2C-42%205%2C0%202%2C-17%22%20stroke%3D%22%23000000%22%20stroke-linecap%3D%22square%22%20stroke-width%3D%221%22%20transform%3D%22translate(61.5%2C45.5)%22%2F%3E%3Cpolyline%20fill%3D%22none%22%20points%3D%225%2C0%202%2C-17%200%2C-15%22%20stroke%3D%22%23000000%22%20stroke-linecap%3D%22square%22%20stroke-width%3D%221%22%20transform%3D%22translate(61.5%2C45.5)%22%2F%3E%3Cline%20stroke%3D%22%23000000%22%20stroke-linecap%3D%22square%22%20stroke-width%3D%221%22%20x1%3D%2273.5%22%20x2%3D%22100.5%22%20y1%3D%223.5%22%20y2%3D%223.5%22%2F%3E%3Cline%20stroke%3D%22%23000000%22%20stroke-linecap%3D%22square%22%20stroke-width%3D%221%22%20x1%3D%2277.5%22%20x2%3D%2296.5%22%20y1%3D%2227.5%22%20y2%3D%2227.5%22%2F%3E%3Ctext%20font-family%3D%22Arial%22%20font-size%3D%2216%22%20font-style%3D%22italic%22%20text-anchor%3D%22middle%22%20x%3D%2283.5%22%20y%3D%2222%22%3Es%3C%2Ftext%3E%3Ctext%20font-family%3D%22Arial%22%20font-size%3D%2212%22%20text-anchor%3D%22middle%22%20x%3D%2291.5%22%20y%3D%2215%22%3E2%3C%2Ftext%3E%3Ctext%20font-family%3D%22Arial%22%20font-size%3D%2216%22%20font-style%3D%22italic%22%20text-anchor%3D%22middle%22%20x%3D%2286.5%22%20y%3D%2244%22%3En%3C%2Ftext%3E%3C%2Fsvg%3E)
where n is the number of replicates (or sample size).
The SEM describes the uncertainty in our estimate of the population mean for a treatment from the available data. The bigger the sample size (i.e., the larger n), the smaller the SEM and the more precise our estimate is.
In our example, there are 12 unique treatment combinations: the 3 levels of Nitrogen by the 4 levels of Sulphur. Note, we can obtain the number of levels of each treatment, and number of blocks, from the degrees of freedom in the ANOVA table.
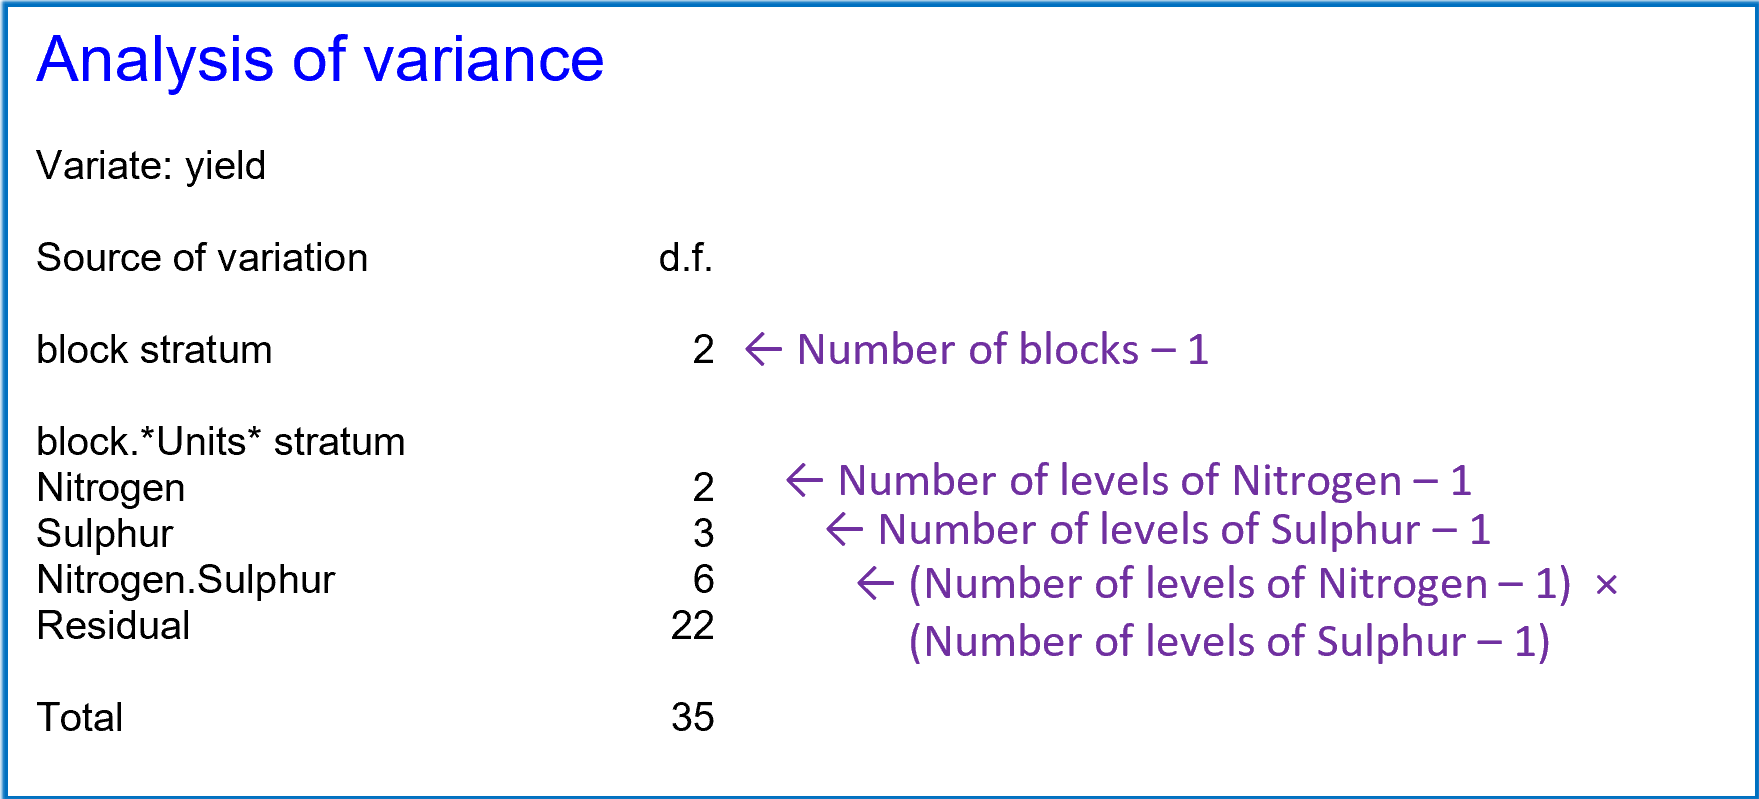
Furthermore, the total number of degrees of freedom + 1, gives us the number of experimental units. Thus, in our example, there are 36 experimental units, with each of the 12 unique treatment combinations occurring exactly once in each of the 3 blocks.
Therefore…
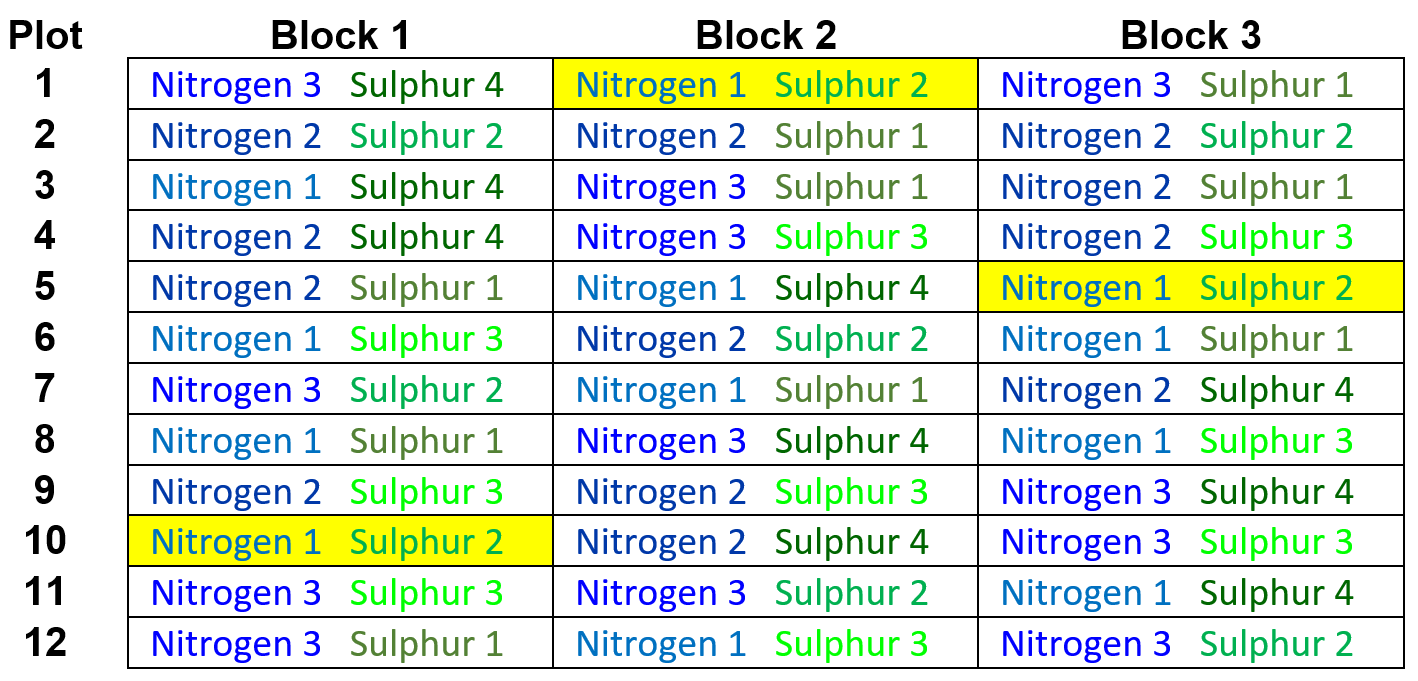
- The 12 Nitrogen by Sulphur means have replication of 3 (1 replicate per block).
For example, the 3 replicates of the treatment corresponding to the first level of Nitrogen and the second level of Sulphur (Nitrogen 1 Sulphur 2) are highlighted yellow in the schematic below of our randomised complete block design:
Thus, the standard error for the Nitrogen by Sulphur means is:
format('truetype')%3Bfont-weight%3Anormal%3Bfont-style%3Anormal%3B%7D%3C%2Fstyle%3E%3C%2Fdefs%3E%3Ctext%20font-family%3D%22math11824c643d1feb4da18b28ed527%22%20font-size%3D%2216%22%20text-anchor%3D%22middle%22%20x%3D%228.5%22%20y%3D%2231%22%3E%3D%3C%2Ftext%3E%3Cpolyline%20fill%3D%22none%22%20points%3D%2212%2C-40%2011%2C-40%205%2C0%202%2C-16%22%20stroke%3D%22%23000000%22%20stroke-linecap%3D%22square%22%20stroke-width%3D%221%22%20transform%3D%22translate(21.5%2C43.5)%22%2F%3E%3Cpolyline%20fill%3D%22none%22%20points%3D%225%2C0%202%2C-16%200%2C-14%22%20stroke%3D%22%23000000%22%20stroke-linecap%3D%22square%22%20stroke-width%3D%221%22%20transform%3D%22translate(21.5%2C43.5)%22%2F%3E%3Cline%20stroke%3D%22%23000000%22%20stroke-linecap%3D%22square%22%20stroke-width%3D%221%22%20x1%3D%2233.5%22%20x2%3D%22103.5%22%20y1%3D%223.5%22%20y2%3D%223.5%22%2F%3E%3Cline%20stroke%3D%22%23000000%22%20stroke-linecap%3D%22square%22%20stroke-width%3D%221%22%20x1%3D%2237.5%22%20x2%3D%2299.5%22%20y1%3D%2225.5%22%20y2%3D%2225.5%22%2F%3E%3Ctext%20font-family%3D%22Arial%22%20font-size%3D%2216%22%20text-anchor%3D%22middle%22%20x%3D%2243.5%22%20y%3D%2220%22%3E0%3C%2Ftext%3E%3Ctext%20font-family%3D%22math11824c643d1feb4da18b28ed527%22%20font-size%3D%2216%22%20text-anchor%3D%22middle%22%20x%3D%2250.5%22%20y%3D%2220%22%3E.%3C%2Ftext%3E%3Ctext%20font-family%3D%22Arial%22%20font-size%3D%2216%22%20text-anchor%3D%22middle%22%20x%3D%2275.5%22%20y%3D%2220%22%3E04483%3C%2Ftext%3E%3Ctext%20font-family%3D%22Arial%22%20font-size%3D%2216%22%20text-anchor%3D%22middle%22%20x%3D%2268.5%22%20y%3D%2242%22%3E3%3C%2Ftext%3E%3Ctext%20font-family%3D%22math11824c643d1feb4da18b28ed527%22%20font-size%3D%2216%22%20text-anchor%3D%22middle%22%20x%3D%228.5%22%20y%3D%2266%22%3E%3D%3C%2Ftext%3E%3Ctext%20font-family%3D%22Arial%22%20font-size%3D%2216%22%20text-anchor%3D%22middle%22%20x%3D%2225.5%22%20y%3D%2266%22%3E0%3C%2Ftext%3E%3Ctext%20font-family%3D%22math11824c643d1feb4da18b28ed527%22%20font-size%3D%2216%22%20text-anchor%3D%22middle%22%20x%3D%2232.5%22%20y%3D%2266%22%3E.%3C%2Ftext%3E%3Ctext%20font-family%3D%22Arial%22%20font-size%3D%2216%22%20text-anchor%3D%22middle%22%20x%3D%2253.5%22%20y%3D%2266%22%3E1222%3C%2Ftext%3E%3C%2Fsvg%3E)
- The 3 Nitrogen means, pooled over the four Sulphur levels, have replication of 12 (3 blocks x 4 levels of Sulphur).
For example, the replicates of the first level of Nitrogen (Nitrogen 1) are highlighted in yellow: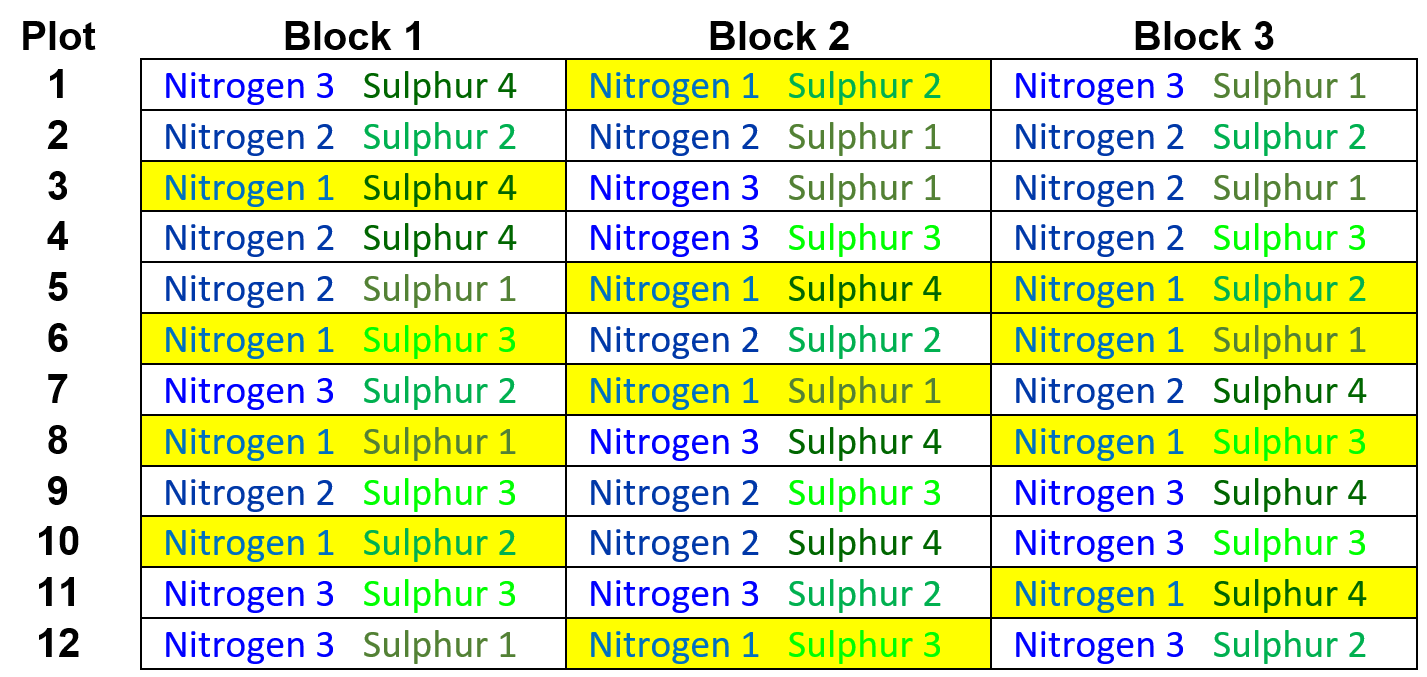
(Note, within each of the 3 blocks, a given level of Nitrogen corresponds to 4 unique treatment combinations: 1 at each level of Sulphur).
Thus, the standard error for the Nitrogen means is:
format('truetype')%3Bfont-weight%3Anormal%3Bfont-style%3Anormal%3B%7D%3C%2Fstyle%3E%3C%2Fdefs%3E%3Ctext%20font-family%3D%22math11824c643d1feb4da18b28ed527%22%20font-size%3D%2216%22%20text-anchor%3D%22middle%22%20x%3D%228.5%22%20y%3D%2231%22%3E%3D%3C%2Ftext%3E%3Cpolyline%20fill%3D%22none%22%20points%3D%2212%2C-40%2011%2C-40%205%2C0%202%2C-16%22%20stroke%3D%22%23000000%22%20stroke-linecap%3D%22square%22%20stroke-width%3D%221%22%20transform%3D%22translate(21.5%2C43.5)%22%2F%3E%3Cpolyline%20fill%3D%22none%22%20points%3D%225%2C0%202%2C-16%200%2C-14%22%20stroke%3D%22%23000000%22%20stroke-linecap%3D%22square%22%20stroke-width%3D%221%22%20transform%3D%22translate(21.5%2C43.5)%22%2F%3E%3Cline%20stroke%3D%22%23000000%22%20stroke-linecap%3D%22square%22%20stroke-width%3D%221%22%20x1%3D%2233.5%22%20x2%3D%22103.5%22%20y1%3D%223.5%22%20y2%3D%223.5%22%2F%3E%3Cline%20stroke%3D%22%23000000%22%20stroke-linecap%3D%22square%22%20stroke-width%3D%221%22%20x1%3D%2237.5%22%20x2%3D%2299.5%22%20y1%3D%2225.5%22%20y2%3D%2225.5%22%2F%3E%3Ctext%20font-family%3D%22Arial%22%20font-size%3D%2216%22%20text-anchor%3D%22middle%22%20x%3D%2243.5%22%20y%3D%2220%22%3E0%3C%2Ftext%3E%3Ctext%20font-family%3D%22math11824c643d1feb4da18b28ed527%22%20font-size%3D%2216%22%20text-anchor%3D%22middle%22%20x%3D%2250.5%22%20y%3D%2220%22%3E.%3C%2Ftext%3E%3Ctext%20font-family%3D%22Arial%22%20font-size%3D%2216%22%20text-anchor%3D%22middle%22%20x%3D%2275.5%22%20y%3D%2220%22%3E04483%3C%2Ftext%3E%3Ctext%20font-family%3D%22Arial%22%20font-size%3D%2216%22%20text-anchor%3D%22middle%22%20x%3D%2269.5%22%20y%3D%2242%22%3E12%3C%2Ftext%3E%3Ctext%20font-family%3D%22math11824c643d1feb4da18b28ed527%22%20font-size%3D%2216%22%20text-anchor%3D%22middle%22%20x%3D%228.5%22%20y%3D%2266%22%3E%3D%3C%2Ftext%3E%3Ctext%20font-family%3D%22Arial%22%20font-size%3D%2216%22%20text-anchor%3D%22middle%22%20x%3D%2225.5%22%20y%3D%2266%22%3E0%3C%2Ftext%3E%3Ctext%20font-family%3D%22math11824c643d1feb4da18b28ed527%22%20font-size%3D%2216%22%20text-anchor%3D%22middle%22%20x%3D%2232.5%22%20y%3D%2266%22%3E.%3C%2Ftext%3E%3Ctext%20font-family%3D%22Arial%22%20font-size%3D%2216%22%20text-anchor%3D%22middle%22%20x%3D%2253.5%22%20y%3D%2266%22%3E0611%3C%2Ftext%3E%3C%2Fsvg%3E)
- The 4 Sulphur means, pooled over the 3 Nitrogen levels, have replication of 9 (3 blocks x 3 levels of Nitrogen).
For example, the replicates of the second level of Sulphur (Sulphur 2) are highlighted yellow: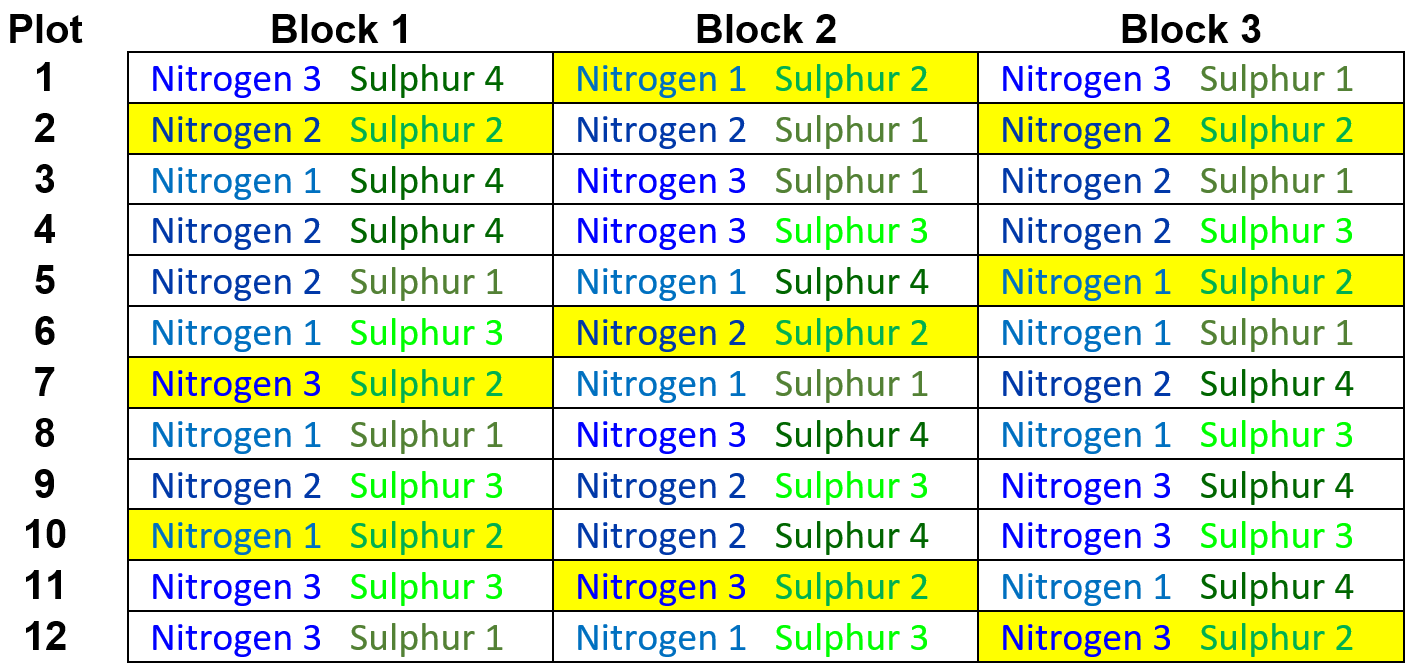
Thus, the standard error for the Sulphur means is:
format('truetype')%3Bfont-weight%3Anormal%3Bfont-style%3Anormal%3B%7D%3C%2Fstyle%3E%3C%2Fdefs%3E%3Ctext%20font-family%3D%22math11824c643d1feb4da18b28ed527%22%20font-size%3D%2216%22%20text-anchor%3D%22middle%22%20x%3D%228.5%22%20y%3D%2231%22%3E%3D%3C%2Ftext%3E%3Cpolyline%20fill%3D%22none%22%20points%3D%2212%2C-40%2011%2C-40%205%2C0%202%2C-16%22%20stroke%3D%22%23000000%22%20stroke-linecap%3D%22square%22%20stroke-width%3D%221%22%20transform%3D%22translate(21.5%2C43.5)%22%2F%3E%3Cpolyline%20fill%3D%22none%22%20points%3D%225%2C0%202%2C-16%200%2C-14%22%20stroke%3D%22%23000000%22%20stroke-linecap%3D%22square%22%20stroke-width%3D%221%22%20transform%3D%22translate(21.5%2C43.5)%22%2F%3E%3Cline%20stroke%3D%22%23000000%22%20stroke-linecap%3D%22square%22%20stroke-width%3D%221%22%20x1%3D%2233.5%22%20x2%3D%22103.5%22%20y1%3D%223.5%22%20y2%3D%223.5%22%2F%3E%3Cline%20stroke%3D%22%23000000%22%20stroke-linecap%3D%22square%22%20stroke-width%3D%221%22%20x1%3D%2237.5%22%20x2%3D%2299.5%22%20y1%3D%2225.5%22%20y2%3D%2225.5%22%2F%3E%3Ctext%20font-family%3D%22Arial%22%20font-size%3D%2216%22%20text-anchor%3D%22middle%22%20x%3D%2243.5%22%20y%3D%2220%22%3E0%3C%2Ftext%3E%3Ctext%20font-family%3D%22math11824c643d1feb4da18b28ed527%22%20font-size%3D%2216%22%20text-anchor%3D%22middle%22%20x%3D%2250.5%22%20y%3D%2220%22%3E.%3C%2Ftext%3E%3Ctext%20font-family%3D%22Arial%22%20font-size%3D%2216%22%20text-anchor%3D%22middle%22%20x%3D%2275.5%22%20y%3D%2220%22%3E04483%3C%2Ftext%3E%3Ctext%20font-family%3D%22Arial%22%20font-size%3D%2216%22%20text-anchor%3D%22middle%22%20x%3D%2268.5%22%20y%3D%2242%22%3E9%3C%2Ftext%3E%3Ctext%20font-family%3D%22math11824c643d1feb4da18b28ed527%22%20font-size%3D%2216%22%20text-anchor%3D%22middle%22%20x%3D%228.5%22%20y%3D%2266%22%3E%3D%3C%2Ftext%3E%3Ctext%20font-family%3D%22Arial%22%20font-size%3D%2216%22%20text-anchor%3D%22middle%22%20x%3D%2225.5%22%20y%3D%2266%22%3E0%3C%2Ftext%3E%3Ctext%20font-family%3D%22math11824c643d1feb4da18b28ed527%22%20font-size%3D%2216%22%20text-anchor%3D%22middle%22%20x%3D%2232.5%22%20y%3D%2266%22%3E.%3C%2Ftext%3E%3Ctext%20font-family%3D%22Arial%22%20font-size%3D%2216%22%20text-anchor%3D%22middle%22%20x%3D%2253.5%22%20y%3D%2266%22%3E0706%3C%2Ftext%3E%3C%2Fsvg%3E)
Confidence interval (ci) for a mean
The confidence interval (CI) for a mean is
x
where is the critical value of the distribution with degrees of freedom. For a confidence interval of C%, . For example, for a 95% confidence interval, . The refers to the residual degrees of freedom. This can be read directly from the ANOVA table.
Interpreting C% confidence interval
In a nutshell, a C% confidence interval for a mean is a range of values that you can be C% certain contains the true population mean. Although, strictly speaking, the confidence level C% represents a long-run percentage: the C% confidence interval gives an estimated range of values that we would expect the true, but unknown, population parameter to lie within C% of the times, should we repeat our experiment a large number of times.
The tables of means for our example are given below:
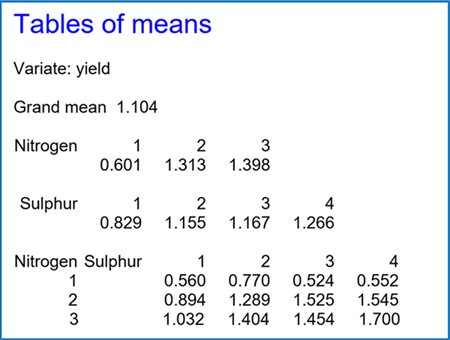
For example, the 95% confidence interval for the overall mean for Sulphur level 4 is:
x
x
Similarly, the 99% confidence interval for the Nitrogen level 1, Sulphur level 3 mean is:
x
x
Calculating standard error of the difference (sed)
The standard error of the difference between two means (SED) is calculated using the following formula:
format('truetype')%3Bfont-weight%3Anormal%3Bfont-style%3Anormal%3B%7D%3C%2Fstyle%3E%3C%2Fdefs%3E%3Ctext%20font-family%3D%22Arial%22%20font-size%3D%2216%22%20font-style%3D%22italic%22%20text-anchor%3D%22middle%22%20x%3D%225.5%22%20y%3D%2219%22%3ES%3C%2Ftext%3E%3Ctext%20font-family%3D%22Arial%22%20font-size%3D%2216%22%20font-style%3D%22italic%22%20text-anchor%3D%22middle%22%20x%3D%2216.5%22%20y%3D%2219%22%3EE%3C%2Ftext%3E%3Ctext%20font-family%3D%22Arial%22%20font-size%3D%2216%22%20font-style%3D%22italic%22%20text-anchor%3D%22middle%22%20x%3D%2228.5%22%20y%3D%2219%22%3ED%3C%2Ftext%3E%3Ctext%20font-family%3D%22math17f39f8317fbdb1988ef4c628eb%22%20font-size%3D%2216%22%20text-anchor%3D%22middle%22%20x%3D%2247.5%22%20y%3D%2219%22%3E%3D%3C%2Ftext%3E%3Ctext%20font-family%3D%22Arial%22%20font-size%3D%2216%22%20font-style%3D%22italic%22%20text-anchor%3D%22middle%22%20x%3D%2265.5%22%20y%3D%2219%22%3ES%3C%2Ftext%3E%3Ctext%20font-family%3D%22Arial%22%20font-size%3D%2216%22%20font-style%3D%22italic%22%20text-anchor%3D%22middle%22%20x%3D%2276.5%22%20y%3D%2219%22%3EE%3C%2Ftext%3E%3Ctext%20font-family%3D%22Arial%22%20font-size%3D%2216%22%20font-style%3D%22italic%22%20text-anchor%3D%22middle%22%20x%3D%2288.5%22%20y%3D%2219%22%3EM%3C%2Ftext%3E%3Ctext%20font-family%3D%22Arial%22%20font-size%3D%2216%22%20font-style%3D%22italic%22%20text-anchor%3D%22middle%22%20x%3D%22104.5%22%20y%3D%2219%22%3Ex%3C%2Ftext%3E%3Cpolyline%20fill%3D%22none%22%20points%3D%2212%2C-16%2011%2C-16%205%2C0%202%2C-6%22%20stroke%3D%22%23000000%22%20stroke-linecap%3D%22square%22%20stroke-width%3D%221%22%20transform%3D%22translate(113.5%2C20.5)%22%2F%3E%3Cpolyline%20fill%3D%22none%22%20points%3D%225%2C0%202%2C-6%200%2C-5%22%20stroke%3D%22%23000000%22%20stroke-linecap%3D%22square%22%20stroke-width%3D%221%22%20transform%3D%22translate(113.5%2C20.5)%22%2F%3E%3Cline%20stroke%3D%22%23000000%22%20stroke-linecap%3D%22square%22%20stroke-width%3D%221%22%20x1%3D%22125.5%22%20x2%3D%22137.5%22%20y1%3D%224.5%22%20y2%3D%224.5%22%2F%3E%3Ctext%20font-family%3D%22Arial%22%20font-size%3D%2216%22%20text-anchor%3D%22middle%22%20x%3D%22131.5%22%20y%3D%2219%22%3E2%3C%2Ftext%3E%3C%2Fsvg%3E)
Note: The formula is different when the sample sizes of the means being compared are unequal.
The SED describes the uncertainty in our estimate of the difference between two population means.
For our example, the SED between …
a) two Nitrogen by Sulphur means is:
format('truetype')%3Bfont-weight%3Anormal%3Bfont-style%3Anormal%3B%7D%3C%2Fstyle%3E%3C%2Fdefs%3E%3Ctext%20font-family%3D%22math11824c643d1feb4da18b28ed527%22%20font-size%3D%2216%22%20text-anchor%3D%22middle%22%20x%3D%228.5%22%20y%3D%2219%22%3E%3D%3C%2Ftext%3E%3Ctext%20font-family%3D%22Arial%22%20font-size%3D%2216%22%20text-anchor%3D%22middle%22%20x%3D%2225.5%22%20y%3D%2219%22%3E0%3C%2Ftext%3E%3Ctext%20font-family%3D%22math11824c643d1feb4da18b28ed527%22%20font-size%3D%2216%22%20text-anchor%3D%22middle%22%20x%3D%2232.5%22%20y%3D%2219%22%3E.%3C%2Ftext%3E%3Ctext%20font-family%3D%22Arial%22%20font-size%3D%2216%22%20text-anchor%3D%22middle%22%20x%3D%2253.5%22%20y%3D%2219%22%3E1222%3C%2Ftext%3E%3Ctext%20font-family%3D%22Arial%22%20font-size%3D%2216%22%20font-style%3D%22italic%22%20text-anchor%3D%22middle%22%20x%3D%2279.5%22%20y%3D%2219%22%3Ex%3C%2Ftext%3E%3Cpolyline%20fill%3D%22none%22%20points%3D%2212%2C-16%2011%2C-16%205%2C0%202%2C-6%22%20stroke%3D%22%23000000%22%20stroke-linecap%3D%22square%22%20stroke-width%3D%221%22%20transform%3D%22translate(88.5%2C20.5)%22%2F%3E%3Cpolyline%20fill%3D%22none%22%20points%3D%225%2C0%202%2C-6%200%2C-5%22%20stroke%3D%22%23000000%22%20stroke-linecap%3D%22square%22%20stroke-width%3D%221%22%20transform%3D%22translate(88.5%2C20.5)%22%2F%3E%3Cline%20stroke%3D%22%23000000%22%20stroke-linecap%3D%22square%22%20stroke-width%3D%221%22%20x1%3D%22100.5%22%20x2%3D%22112.5%22%20y1%3D%224.5%22%20y2%3D%224.5%22%2F%3E%3Ctext%20font-family%3D%22Arial%22%20font-size%3D%2216%22%20text-anchor%3D%22middle%22%20x%3D%22106.5%22%20y%3D%2219%22%3E2%3C%2Ftext%3E%3Ctext%20font-family%3D%22math11824c643d1feb4da18b28ed527%22%20font-size%3D%2216%22%20text-anchor%3D%22middle%22%20x%3D%228.5%22%20y%3D%2243%22%3E%3D%3C%2Ftext%3E%3Ctext%20font-family%3D%22Arial%22%20font-size%3D%2216%22%20text-anchor%3D%22middle%22%20x%3D%2225.5%22%20y%3D%2243%22%3E0%3C%2Ftext%3E%3Ctext%20font-family%3D%22math11824c643d1feb4da18b28ed527%22%20font-size%3D%2216%22%20text-anchor%3D%22middle%22%20x%3D%2232.5%22%20y%3D%2243%22%3E.%3C%2Ftext%3E%3Ctext%20font-family%3D%22Arial%22%20font-size%3D%2216%22%20text-anchor%3D%22middle%22%20x%3D%2253.5%22%20y%3D%2243%22%3E1728%3C%2Ftext%3E%3C%2Fsvg%3E)
b) two overall Nitrogen means is:
format('truetype')%3Bfont-weight%3Anormal%3Bfont-style%3Anormal%3B%7D%3C%2Fstyle%3E%3C%2Fdefs%3E%3Ctext%20font-family%3D%22math11824c643d1feb4da18b28ed527%22%20font-size%3D%2216%22%20text-anchor%3D%22middle%22%20x%3D%228.5%22%20y%3D%2219%22%3E%3D%3C%2Ftext%3E%3Ctext%20font-family%3D%22Arial%22%20font-size%3D%2216%22%20text-anchor%3D%22middle%22%20x%3D%2225.5%22%20y%3D%2219%22%3E0%3C%2Ftext%3E%3Ctext%20font-family%3D%22math11824c643d1feb4da18b28ed527%22%20font-size%3D%2216%22%20text-anchor%3D%22middle%22%20x%3D%2232.5%22%20y%3D%2219%22%3E.%3C%2Ftext%3E%3Ctext%20font-family%3D%22Arial%22%20font-size%3D%2216%22%20text-anchor%3D%22middle%22%20x%3D%2253.5%22%20y%3D%2219%22%3E0611%3C%2Ftext%3E%3Ctext%20font-family%3D%22Arial%22%20font-size%3D%2216%22%20font-style%3D%22italic%22%20text-anchor%3D%22middle%22%20x%3D%2279.5%22%20y%3D%2219%22%3Ex%3C%2Ftext%3E%3Cpolyline%20fill%3D%22none%22%20points%3D%2212%2C-16%2011%2C-16%205%2C0%202%2C-6%22%20stroke%3D%22%23000000%22%20stroke-linecap%3D%22square%22%20stroke-width%3D%221%22%20transform%3D%22translate(88.5%2C20.5)%22%2F%3E%3Cpolyline%20fill%3D%22none%22%20points%3D%225%2C0%202%2C-6%200%2C-5%22%20stroke%3D%22%23000000%22%20stroke-linecap%3D%22square%22%20stroke-width%3D%221%22%20transform%3D%22translate(88.5%2C20.5)%22%2F%3E%3Cline%20stroke%3D%22%23000000%22%20stroke-linecap%3D%22square%22%20stroke-width%3D%221%22%20x1%3D%22100.5%22%20x2%3D%22112.5%22%20y1%3D%224.5%22%20y2%3D%224.5%22%2F%3E%3Ctext%20font-family%3D%22Arial%22%20font-size%3D%2216%22%20text-anchor%3D%22middle%22%20x%3D%22106.5%22%20y%3D%2219%22%3E2%3C%2Ftext%3E%3Ctext%20font-family%3D%22math11824c643d1feb4da18b28ed527%22%20font-size%3D%2216%22%20text-anchor%3D%22middle%22%20x%3D%228.5%22%20y%3D%2243%22%3E%3D%3C%2Ftext%3E%3Ctext%20font-family%3D%22Arial%22%20font-size%3D%2216%22%20text-anchor%3D%22middle%22%20x%3D%2225.5%22%20y%3D%2243%22%3E0%3C%2Ftext%3E%3Ctext%20font-family%3D%22math11824c643d1feb4da18b28ed527%22%20font-size%3D%2216%22%20text-anchor%3D%22middle%22%20x%3D%2232.5%22%20y%3D%2243%22%3E.%3C%2Ftext%3E%3Ctext%20font-family%3D%22Arial%22%20font-size%3D%2216%22%20text-anchor%3D%22middle%22%20x%3D%2253.5%22%20y%3D%2243%22%3E0864%3C%2Ftext%3E%3C%2Fsvg%3E)
and
c) two overall Sulphur means is:
format('truetype')%3Bfont-weight%3Anormal%3Bfont-style%3Anormal%3B%7D%3C%2Fstyle%3E%3C%2Fdefs%3E%3Ctext%20font-family%3D%22math11824c643d1feb4da18b28ed527%22%20font-size%3D%2216%22%20text-anchor%3D%22middle%22%20x%3D%228.5%22%20y%3D%2219%22%3E%3D%3C%2Ftext%3E%3Ctext%20font-family%3D%22Arial%22%20font-size%3D%2216%22%20text-anchor%3D%22middle%22%20x%3D%2225.5%22%20y%3D%2219%22%3E0%3C%2Ftext%3E%3Ctext%20font-family%3D%22math11824c643d1feb4da18b28ed527%22%20font-size%3D%2216%22%20text-anchor%3D%22middle%22%20x%3D%2232.5%22%20y%3D%2219%22%3E.%3C%2Ftext%3E%3Ctext%20font-family%3D%22Arial%22%20font-size%3D%2216%22%20text-anchor%3D%22middle%22%20x%3D%2253.5%22%20y%3D%2219%22%3E0706%3C%2Ftext%3E%3Ctext%20font-family%3D%22Arial%22%20font-size%3D%2216%22%20font-style%3D%22italic%22%20text-anchor%3D%22middle%22%20x%3D%2279.5%22%20y%3D%2219%22%3Ex%3C%2Ftext%3E%3Cpolyline%20fill%3D%22none%22%20points%3D%2212%2C-16%2011%2C-16%205%2C0%202%2C-6%22%20stroke%3D%22%23000000%22%20stroke-linecap%3D%22square%22%20stroke-width%3D%221%22%20transform%3D%22translate(88.5%2C20.5)%22%2F%3E%3Cpolyline%20fill%3D%22none%22%20points%3D%225%2C0%202%2C-6%200%2C-5%22%20stroke%3D%22%23000000%22%20stroke-linecap%3D%22square%22%20stroke-width%3D%221%22%20transform%3D%22translate(88.5%2C20.5)%22%2F%3E%3Cline%20stroke%3D%22%23000000%22%20stroke-linecap%3D%22square%22%20stroke-width%3D%221%22%20x1%3D%22100.5%22%20x2%3D%22112.5%22%20y1%3D%224.5%22%20y2%3D%224.5%22%2F%3E%3Ctext%20font-family%3D%22Arial%22%20font-size%3D%2216%22%20text-anchor%3D%22middle%22%20x%3D%22106.5%22%20y%3D%2219%22%3E2%3C%2Ftext%3E%3Ctext%20font-family%3D%22math11824c643d1feb4da18b28ed527%22%20font-size%3D%2216%22%20text-anchor%3D%22middle%22%20x%3D%228.5%22%20y%3D%2243%22%3E%3D%3C%2Ftext%3E%3Ctext%20font-family%3D%22Arial%22%20font-size%3D%2216%22%20text-anchor%3D%22middle%22%20x%3D%2225.5%22%20y%3D%2243%22%3E0%3C%2Ftext%3E%3Ctext%20font-family%3D%22math11824c643d1feb4da18b28ed527%22%20font-size%3D%2216%22%20text-anchor%3D%22middle%22%20x%3D%2232.5%22%20y%3D%2243%22%3E.%3C%2Ftext%3E%3Ctext%20font-family%3D%22Arial%22%20font-size%3D%2216%22%20text-anchor%3D%22middle%22%20x%3D%2253.5%22%20y%3D%2243%22%3E0998%3C%2Ftext%3E%3C%2Fsvg%3E)
Using LSD for statistical significance
Two means can be compared using their least significant difference (LSD). The LSD gives the smallest value in which the absolute difference between the two means is deemed to be is statistically significant at the α level of significance. The LSD is given by:
( x 100%) x
Thus, for our example, the LSD(5%) for comparing …
a) two Nitrogen by Sulphur means is:
% = x
= x
=
b) two overall Nitrogen means is:
% = x
= x
=
c) two overall Sulphur means is:
% = x
= x
=
Using the overall means for Nitrogen as an example, at the 5% significance level…
- there is statistical evidence that the Nitrogen 1 and Nitrogen 2 means differ
, the LSD(5%)
- there is statistical evidence that the Nitrogen 1 and Nitrogen 3 means differ
, the LSD(5%)
- there is NO statistical evidence that the Nitrogen 2 and Nitrogen 3 means differ
, the LSD(5%)
Confidence interval for difference between means
The difference between two means can be also compared, and more fully described, using a confidence interval for the difference between two means. This is given by:
x
or, equivalently,
x x 100%
where and are the two means being compared.
Once again, using the overall means for Nitrogen as an example, the 95% confidence interval for the difference between:
- the Nitrogen 1 and Nitrogen 2 means is:
- the Nitrogen 1 and Nitrogen 3 means is:
- the Nitrogen 2 and Nitrogen 3 means is:
Notice that the CIs comparing Nitrogen 1 with Nitrogen 2, and Nitrogen 1 with Nitrogen 3, both exclude zero. Hence, we can conclude, at the 5% significance level, that the mean for Nitrogen 1 is significant differently from both the Nitrogen 2 and Nitrogen 3 means. (In this case the mean for Nitrogen 1 is lower than that of Nitrogen 2 and Nitrogen 3). Conversely, as the CI comparing Nitrogen 2 and Nitrogen 3 includes zero, we conclude that there is no evidence of a difference between these two means (at the 5% significance level).
Luckily for us, we rarely need to calculate these quantities ourselves, as they are generated by most statistical software packages. However, it is useful to understand how they are calculated and how they are related. For example, in order to scrutinize reported results, or to calculate, at a later date, a quantity that you’ve forgotten to generate.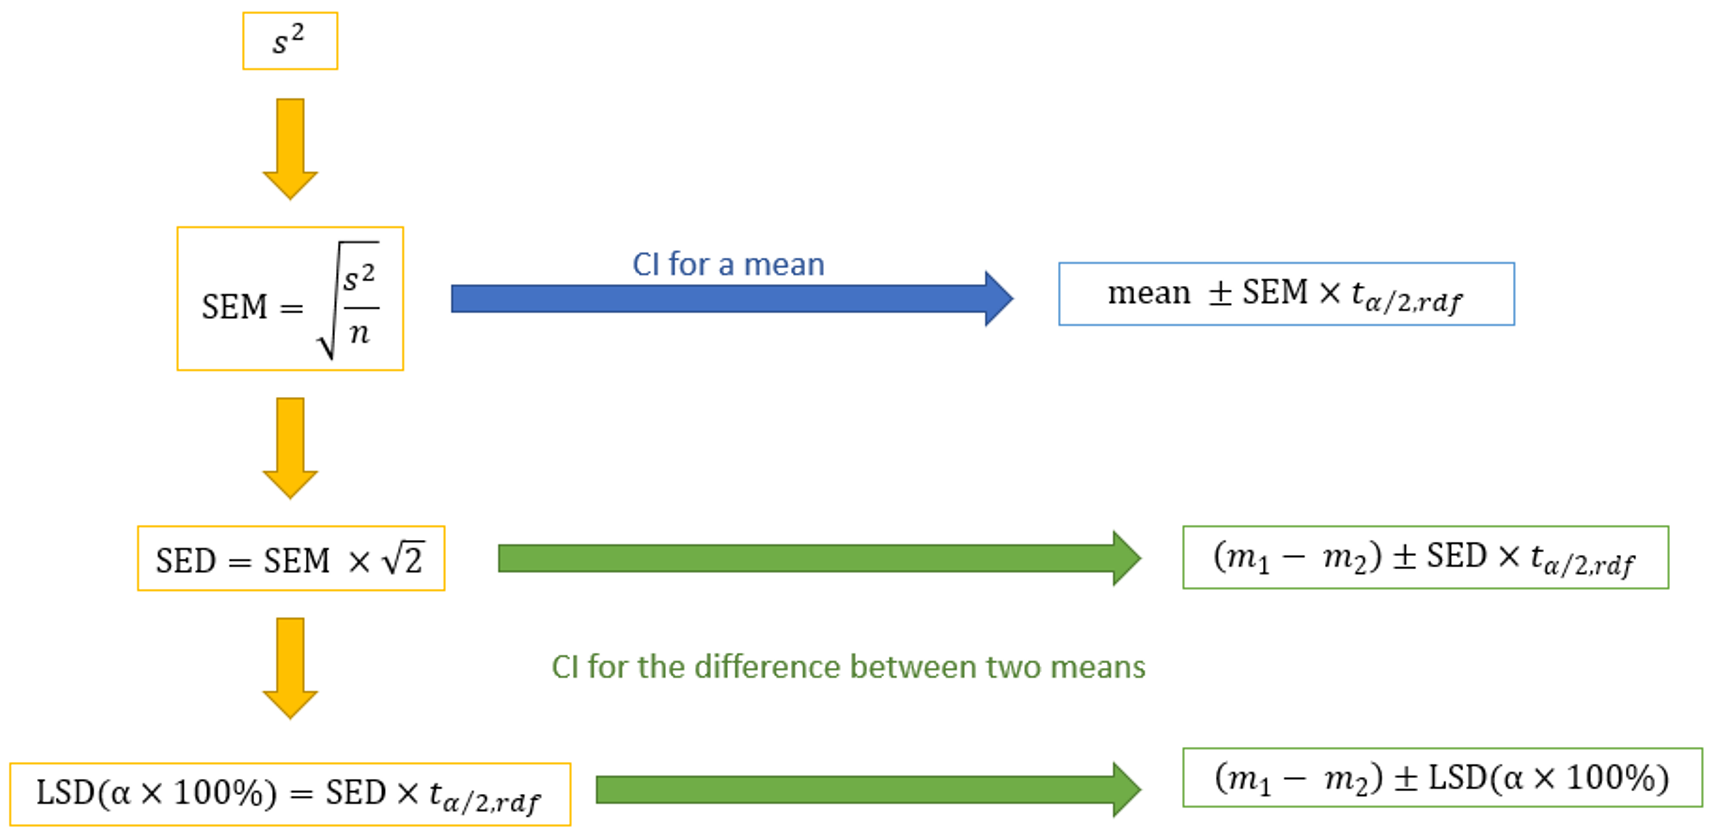
ANOVA tools in Genstat
Genstat has a very powerful set of ANOVA tools, that are straightforward and easy to use. In addition to the ANOVA table, you can readily output the treatment means, SEMs, SEDs, LSDs and CIs.
About the author
Dr. Vanessa Cave is an applied statistician interested in the application of statistics to the biosciences, in particular agriculture and ecology, and is a developer of the Genstat statistical software package. She has over 15 years of experience collaborating with scientists, using statistics to solve real-world problems. Vanessa provides expertise on experiment and survey design, data collection and management, statistical analysis, and the interpretation of statistical findings. Her interests include statistical consultancy, mixed models, multivariate methods, statistical ecology, statistical graphics and data visualisation, and the statistical challenges related to digital agriculture.
Vanessa is currently President of the Australasian Region of the International Biometric Society, past-President of the New Zealand Statistical Association, an Associate Editor for the Agronomy Journal, on the Editorial Board of The New Zealand Veterinary Journal and an honorary academic at the University of Auckland. She has a PhD in statistics from the University of St Andrew.
Popular


Related Reads